Correlation views
The Correlation views display a measure of the similarity between the received echoes. Correlation is a measure of data quality. The output is scaled in percent.
How to open
Use the ADCP View Settings dialog box to select this view. The ADCP View Settings dialog box is located on the Active menu.
Description
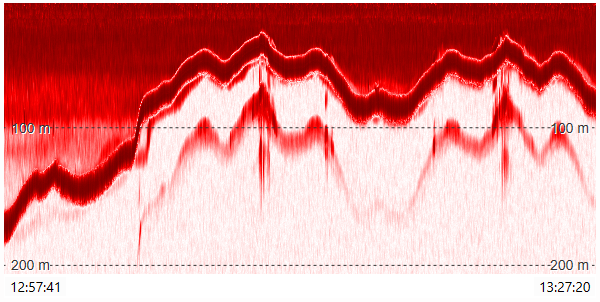
The Correlation views display a visualisation the dependence or likeness between the transmitted pulse and the received echo.
By default, the vertical axis presents the depth in metres. The horizontal axis is shown with time stamps. By default the ADCP views cover the entire screen and display information horizontally.
Each acoustic ADCP beam is identified with a nautical orientation related to the numbering of the views.
| 1 | Fore Starboard |
| 2 | Aft Port |
| 3 | Aft Starboard |
| 4 | Fore Port |
Correlation is the comparison of the return signal of a pulse to itself as it appears as an echo received. The correlation is perfect (100%) as the return signal is coming from one (and the same) set of scatters in each beam. As time increases, both the original pulse and the echo have moved longer through the water. There are two main reasons to this.
| • | The whole group of scatters has moved because of the velocity of the currents. This is the Doppler shift and is the desired information for calculating water velocity. |
| • | New scatters have entered the volume of the pulse while others have left it producing uncertainty in the Doppler estimate. |
The correlation between the signals is now less than 100%.
Details

The colour scale for ADCP Backscatter is by default a Smooth Echo sounder scale. To change the colour scale, use the Colour Setup dialog box.
Tip
Move the cursor across the view to obtain numerical information from the ADCP presentation. By default, the information is related to the exact position of the cursor.