Bottom echogram description
The Bottom echogram shows the echoes over and below the sea bottom contour. Since this echogram is referenced to the sea bottom, the sea surface will vary with the actual depth, while the bottom is
drawn flat. You can select the start range (the depth from which the echogram starts) and the vertical range (the vertical "length" of
the echogram) by means of the Start Range and Range settings. Both the Range and the Start Range functions are located on the Main menu.
How to open

To activate Bottom echogram, click in the chosen view to make it "active". Select Echogram on the Active menu. Select the Echogram tab to open the page. On the Echogram page, set Echogram type to Bottom.
Description
A Bottom echogram is mainly used when you want to examine the echoes from fish close to the sea bottom. Set up the Start Range and Range depths to hide the surface and place the sea bottom contour at the middle of the echogram. You can investigate the sea bottom conditions and hardness, and detect fish.
Note
The echogram is only drawn for pings that have a successful bottom detection.
Since the Bottom echogram is referenced to the bottom, the Start Range value must be negative. If you wish to start your echogram from 10 meters above the bottom, you must set the Start Range to –10 m. The Range setting defines the vertical range from the start depth and down.
Tip

For closer investigation, use the Zoom information pane to enlarge the bottom echoes.
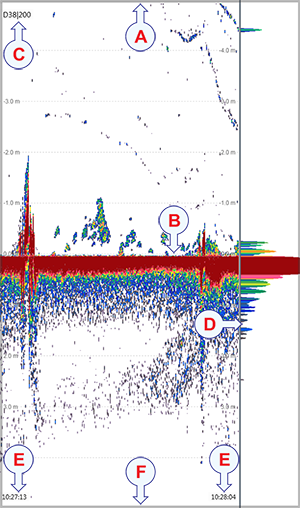
| A | This is the start depth of the echogram In a Bottom echogram you will probably wish to start the echogram from a fixed distance above the bottom. To do this, you must set the
Start Range to a negative value, for example -10 m. This negative value defines how many meters above the bottom the echogram will start.
The Range value defines the vertical "height" of the echogram. To make sense, the value must be positive, and numerically larger than
the chosen Start Range. If you have chosen to start your echogram from -10 m, the range must be larger than 10 meters, for example 20 meters.
|
| B | This is the bottom (seabed) The bottom is shown with a strong contour. Since the echogram is referenced to the sea surface, the bottom will vary with
the actual depth.
Different bottom conditions will have a visual effect on how the bottom echo is drawn. A hard bottom (rock) will give you
a stronger echo - and thus a darker colour - than a soft bottom (mud or silt).
The Echogram page in the Echogram dialog box allows you to make adjustments to the bottom contour. You can add a black bottom line, and a white line to make the bottom "stand out".
|
| C | Transducer identification This text identifies the transducer - and thus also the channel - used to create the echogram. In this context, the term channel is used as a common term to identify the combination of transceiver, transducer and operating frequency.
|
| D | This is the scope view The Scope view is used to indicate how strong each echo is. The colour and the length of each line reflects the received echo amplitude.
|
| E | These are the labels Small labels are shown in the bottom left and right corners of the view. These labels can contain time or distance to identify the horizontal axis of the echogram. You can hide the labels from view.
The labels can be changed on the Horizontal Axis page in the Echogram dialog box.
|
| F | This is the lower end of the chosen depth range This depth is normally a few meters below the bottom contour, depending on the chosen range. The total echogram range (A) to (F) is defined with the Range button on the Main menu.
|
Example
Start Range and Range in bottom-related echogram
In a bottom echogram, set the Start Range value to –5 metres. This will make the echogram start from 5 metres above the sea bottom. Set Range to the 5 metres plus 10 = 15 metres. The echogram will now show the area from 5 metres above the depth, and down to 10 meters
"below" the sea bottom. The sea bottom contour will appear as a flat line.