Percent Good view
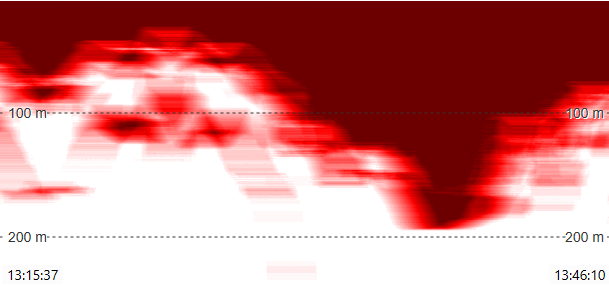
The Percent Good view displays the percentage of pings which has passed a set of defined quality criteria. The rejection criteria include low correlation and large error velocity. By setting a threshold value for Percent Good and enable the echoes to get filtered by these values you remove unwanted results from all your ADCP views.
How to open
Use the ADCP View Settings dialog box to select this view. The ADCP View Settings dialog box is located on the Active menu.

Description
By default, the vertical axis presents the depth in metres. The horizontal axis is shown with time stamps. Percent Good is measured in percent.
In regions where data are good, the Percent Good value will often stay very high (near 100%) for most of the profile, plummeting
to a low at the bottom. In regions where bubbles or other acoustic noise cause signal attenuation or blockage, the Percent Good value can have a more
linear profile with depth. Under these conditions there are often dubious looking "tails" in the velocity near the bottom for the profiles.
Details

The colour scale for the Percent Good view is gradient using a single colour. Good data is represented by a deeper red colour, less good data is represented by lighter reds or white.
Move the cursor across the view to obtain numerical information from the ADCP presentation. By default, the information is related to the exact position of the cursor.