Geo Velocity views
The Geo Velocity views display water velocity relative to earth coordinates, i.e. water current velocity. The water current velocity is displayed in the cardinal directions (north-south, east-west), as well as velocity down towards
the bottom. Water current speed is displayed in a separate view. By default the ADCP views cover the entire screen and display information horizontally.
How to open
Use the ADCP View Settings dialog box to select this view. The ADCP View Settings dialog box is located on the Active menu.
Description
The Geo Velocity views display water velocity relative to earth coordinates, i.e. water current velocity. The geo velocities are estimated from the vessel velocities which again are estimated from the beam velocities. The velocity impact of the movement of the vessel is removed from these data. Velocity can be measured in different units.
| • | The Geo North Velocity view displays water current velocity in the north/south direction.
|
| • | The Geo East Velocity view displays water current velocity in the east/west direction.
|
| • | The Geo Down Velocity displays water current velocity in the downward direction towards the seafloor. The estimated velocity is compensated for
the heave and pitch of the vessel.
|
| • | The Geo Speed view displays water speed as an absolute value indicating no direction. |
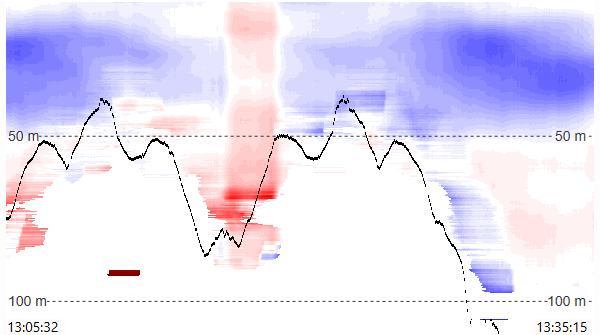
Geo North Velocity displays a velocity of -0.17 m/s. This indicates a current of 0.17 m/s going southwards.
By default, the vertical axis presents the depth in metres. The horizontal axis is shown with time stamps.
Details
The colour scale for is bipolar using two colours. It visualises the direction and magnitude of the velocity. Blue colour indicates negative values for velocity. Red colour indicates positive values for velocity.Higher velocities are displayed using a deeper colour. The colour displays direction of the velocity.
ADCP Colour Span is used to set the maximum velocity values (positive and negative). ADCP Colour Span is located on the Active menu.If the velocities displayed is in the range -0.5 m/s to 0.5 m/s, ADCP Colour Span should have the value 0.5 m/s in order to visualise the velocity with the best colour resolution.The maximum value should be set in relationship to the velocities displayed.
Tip
Move the cursor across the view to obtain numerical information from the ADCP presentation. By default, the information is related to the exact position of the cursor.

The colour scale for speed is gradient. High speed is displayed using deeper reds and lower speed is displayed using lighter reds.
Tip
Move the cursor across the view to obtain numerical information from the ADCP presentation. The information provided for noise shows you the noise reading for the latest ping independent of the cursor’s location.