Trawl echogram description
The Trawl echogram covers the vertical opening of the trawl with reference to the depth of the headrope. In addition to the trawl opening, the echogram covers a certain range over and under the trawl opening. You can select the start range (the depth from which the echogram starts) and the vertical range (the vertical "length" of
the echogram) by means of the Start Range and Range settings. Both the Range and the Start Range functions are located on the Main menu.
How to open

To activate Trawl echogram, click in the chosen view to make it "active". Select Echogram on the Active menu. Select the Echogram tab to open the page. On the Echogram page, set Echogram type to Trawl.
Description
Trawl sensor systems (such as Simrad PI, PX and ITI) communicate headrope depth, and/or the distance from the headrope to the footrope (trawl opening), to the
EK80 system at regular intervals. The information can be used to draw the upper and/or lower trawl lines in the echogram. If another trawl or catch monitoring system is used, and this system does not provide the trawl opening and/or trawl distance
automatically, the values must be entered manually.
This information is required for the trawl echogram to be generated. Without the depth of the headrope, the echogram would appear like a standard pelagic echogram controlled by the Range and Start Range settings.
Note
The Trawl echogram is only drawn when trawl position information is available.
The distance from the headrope to the footrope (trawl opening) can be manually set on the Trawl page. This is useful for trawl sensor systems that do not measure the trawl opening, or when the measured distance is unreliable. You can also provide the distance from the vessel to the trawl opening. The depth of the headrope must however be imported from the catch monitoring system. The Trawl page is located in the Installation dialog box.
The biomass calculations in a Trawl echogram are not restricted by the bottom detection. This means that the bottom echo will be included in the calculations if it appears within the chosen range.
Tip

For closer investigation, use the Zoom information pane to enlarge echoes from the water column.
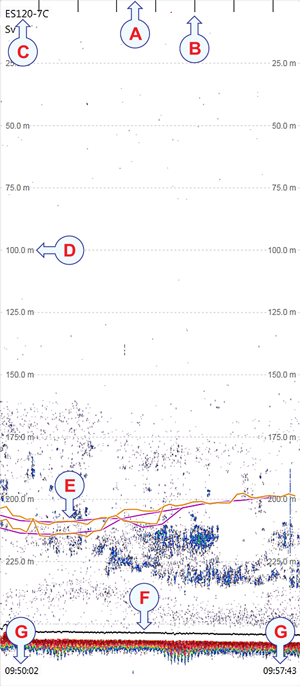
| A | This is the start depth of the echogram In a Trawl echogram you may wish to start the echogram from a certain distance below the surface, and will then set the Start Range to a relatively large numerical value. In this example, the start depth is 0 meters.
|
| B | Vertical Ticks These lines are used to measure time or distance. You can switch these vertical ticks on or off on the Lines page in the Echogram dialog box. The Echogram dialog box is located on the Active menu.
|
| C | Transducer identification This text identifies the transducer - and thus also the channel - used to create the echogram. In this context, the term channel is used as a common term to identify the combination of transceiver, transducer and operating frequency.
|
| D | Scale Lines When enabled, equidistant horizontal scale lines are drawn inside the view in the current foreground colour; black during
day and white during night. You can switch the scale lines on or off on the Lines page in the Echogram dialog box. The Echogram dialog box is located on the Active menu.
|
| E | Trawl lines Trawl sensor systems (such as Simrad PI, PX and ITI) communicate headrope depth, and/or the distance from the headrope to the footrope (trawl opening), to the
EK80 system at regular intervals. The information can be used to draw the upper and/or lower trawl lines in the echogram. You can switch the trawl lines on or off on the Lines page in the Echogram dialog box. The Echogram dialog box is located on the Active menu.
|
| F | This is the bottom (seabed) The bottom is shown with a strong contour. Since the echogram is referenced to the sea surface, the bottom will vary with
the actual depth. Different bottom conditions will have a visual effect on how the bottom echo is drawn. A hard bottom (rock) will give you
a stronger echo - and thus a darker colour - than a soft bottom (mud or silt).
The Echogram page in the Echogram dialog box allows you to make adjustments to the bottom contour. You can add a black bottom line, and a white line to make the bottom "stand out".
|
| G | These are the labels Small labels are shown in the bottom left and right corners of the view. These labels can contain time or distance to identify the horizontal axis of the echogram. You can hide the labels from view.
The labels can be changed on the Horizontal Axis page in the Echogram dialog box.
|