Error Velocity view
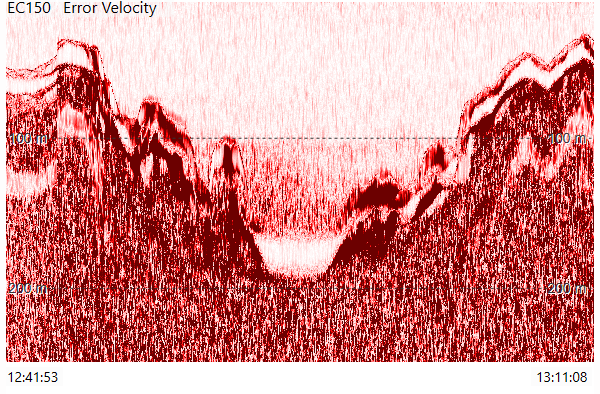
The Error Velocity view displays a graphic representation of errors velocities in the drawing range of the water column. Difference in colours close to ascents/descents will indicate higher/lower error velocities in these areas.
How to open
Use the ADCP View Settings dialog box to select this view. The ADCP View Settings dialog box is located on the Active menu.
Description
Error velocity is the difference between two estimates of the vertical velocity. Errors occur mainly due to inhomogeneities in the water, or malfunctioning equipment. Error velocity will show the magnitude of the errors, not the source.It is an important means to evaluate the data quality.It is calculated using beam velocity data.
By default, the vertical axis presents the depth in metres. The horizontal axis is shown with time stamps. The drawing range of the view, i.e. the vertical axis definition of deepest depth, can be configured. In this illustration, full drawing range is used.
Error Velocity is measured in m/s or knots.
Details

The colour scale for ADCP error velocity is gradient using a single colour. This visualises smaller errors using a lighter red and larger errors using darker red.
ADCP Colour Span is used to set the maximum velocity values. ADCP Colour Span is located on the Active menu. The maximum value should be set in relationship to the velocities displayed. If the error velocities displayed is in the range -0 to 0.5 m/s, ADCP Colour Span should have the value 0.5 m/s in order to visualise the error velocity with the best colour resolution.
Move the cursor across the view to obtain numerical information from the ADCP presentation. By default, the information is related to the exact position of the cursor.