Lines page
The Lines page in the Echogram dialog box allows you to control the horizontal and vertical lines used in the echogram presentation. You can make the bottom easier to see, and add lines that hold additional information. The vertical scale of the echogram presentation can be changed. If you wish to add annotations to your echogram, these are enabled on this page.
Prerequisites
This page is not available when ADCP is activated.
How to open
This page is located in the Echogram dialog box. The Echogram dialog box is located on the Active menu.
Description
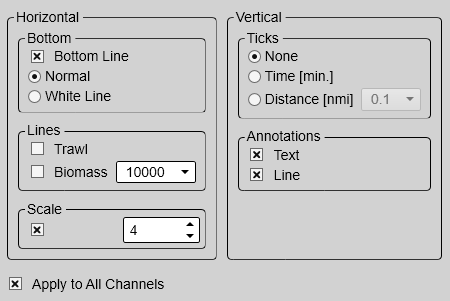
The settings on the Lines page are all related to visual appearance.
Note
Before you can change a setting related to a echogram, you must click inside the echogram to activate it. The setting is by default only applied to currently selected echogram. Select Apply to All if you wish to use the chosen settings on all the echograms of the same type.
Details
Bottom
The bottom line can be switched off or on. You can enable a white line to enhance the bottom contour presentation.
| • | Bottom Line: This is an "on/off" switch. Select the box to enable the function. A bottom line can be added to your echogram to enhance the visual bottom detection. It appears as thin line that follows the bottom contour. The line is drawn in the current foreground colour. |
| • | White Line: This is an "on" switch. A white line can be added to your echogram to enhance the visual bottom detection. It appears as thick line in the current background colour (normally white) that follows the bottom contour. This line will not remove information, it will simply "push" the echo information further down in order to make the bottom easier to see. You can use the white and the bottom lines simultaneously. Select Normal to disable the line. |
| • | Normal: This is an "off" switch. The white line is disabled. The bottom line is drawn in the current foreground colour. |
Lines
You can enable or disable one or more horizontal lines on the echogram.
| • | Trawl: This is an "on/off" switch. Select the box to enable the function. Trawl sensor systems (such as Simrad PI, PX and ITI) communicate headrope depth, and/or the distance from the headrope to the footrope (trawl opening), to the
EK80 system at regular intervals. The information can be used to draw the upper and/or lower trawl lines in the echogram. Manual trawl setup information can be typed in using the Trawl parameters. This is useful for sensor systems that do not measure the trawl opening, or when the measured headrope-to-footrope distance
is unreliable. If you have a relevant system in use, you can monitor the depth of the applicable sensors. The Trawl page is located in the Installation dialog box.
|
| • | Biomass: This is an "on/off" switch. Select the box to enable the function. This function writes an extra thick and brightly coloured curve on the echogram. The biomass line shows you the integrated biomass for the pings within the selected calculation interval. Change the scale to fit the vertical space available on the echogram. |
Scale
When enabled, equidistant horizontal scale lines are drawn inside the view in the current foreground colour; black during
day and white during night. A maximum of 10 scale lines can be selected. No scale lines are drawn when the scale line count is set to 0 (zero).
Vertical
These options control vertical markers and annotations.
| • | Ticks This function places short vertical markers on the top of the echogram. These lines are used to measure time or distance.
|
| • | Annotations Select Text or Line to allow annotation markers to be shown. If you select Line, each text annotation is followed by a vertical line for improved visibility. Annotations can be typed in manually, set up for automatic generation, or imported from an external device.
Tip
Use the Annotations page to type comments and insert annotations into views. Several different annotation types may be added to the echograms or other views. The Annotations page is located in the Installation dialog box.
When you save raw data, the annotations you have defined are stored as annotation datagrams.
|
Apply to All
Select Apply to All to use the chosen settings on all the ADCP views of the same type.