3 Getting to know the user interface
The display presentation provided by the EK80 system consists of specific visual elements that work together. The visual elements provide you with the echo information you need, they help you to control the functionality needed to understand
this information, and finally, they allow you to control the operational parameters. By default, the display presentation covers the entire screen.
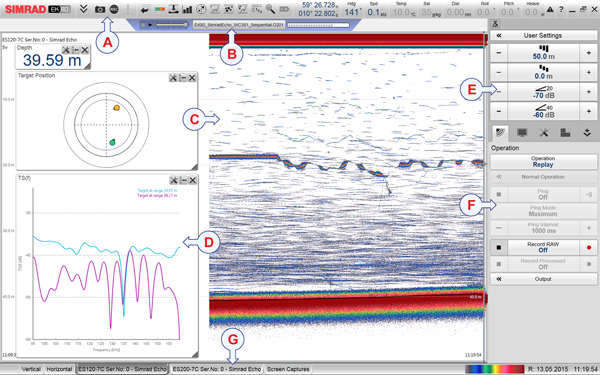
| A | Top bar |
| B | Replay bar |
| C | Echogram view |
| D | Information panes |
| E | Main menu |
| F | Secondary menus |
| G | Bottom bar |
Procedure
| 1 | Move the cursor to the top bar, and investigate the functions provided. Observe that small tooltips open to identify the various functions you can use.
The top bar is located at the top of the display presentation and stretches from the far left to the far right. The top bar gives you fast access to key functionality and navigational information. It provides buttons for hiding and showing the menu, making screen captures, opening the Messages dialog box, and opening context-sensitive help. And more importantly, from the top bar you can see when data recording is active.
|
| 2 | Observe the information pane "buttons" on the top bar. The EK80 system offers several information panes to provide additional and detailed data from the presentations. The information panes are opened and closed from the top bar. Before you open an information pane, you must first click in an echogram view to make it "active".
|
| 3 | Move the cursor to the menu system on the right side of the presentation. The Main menu is located at the top of the menu structure. It offers the most common functions for efficient use of the EK80 system. Below the Main menu, a set of dedicated icons are used to open the secondary menus. Select the icon one more time to close the menu.
|
| 4 | Move the cursor to the bottom of the display presentation. The tabs on the bottom bar allows you to choose channel and presentation mode. A dedicated tab provides a special view for you to see the screen captures you have made. The bottom bar also shows you the current echogram colour scale, as well as the time and date for the last ping.
|
| 5 | Move the cursor to the bottom of the display presentation. The bottom bar is located at the bottom of the display presentation and stretches from the left side to the right side. The tabs on the bottom bar allows you to choose channel and presentation mode. A dedicated tab provides a special view for you to see the screen captures you have made. The bottom bar also shows you the current echogram colour scale, as well as the time and date for the last ping.
|
| 6 | Move the cursor to the echogram views in the main display presentation. The EK80 system supports several different echogram types. Each echogram is shown in a separate view in the display presentation. The tabs at the bottom of the display presentation allows you to choose which channels to open. You can change the physical size of any view. Click on the view border, hold the button depressed, then drag the border to create a smaller or larger rectangle. Note that the size of the other views are changed accordingly!
|
| 7 | Click inside one of the echogram views. Before you can change the settings related to a view, you must click inside the view to activate it. The changes you make are by default only valid for the active view. Observe that the border lines of the active view are drawn with a thicker line.
Several of the functions offer Apply to All. If you select Apply to All your setting is applied to all the views simultaneously.
|