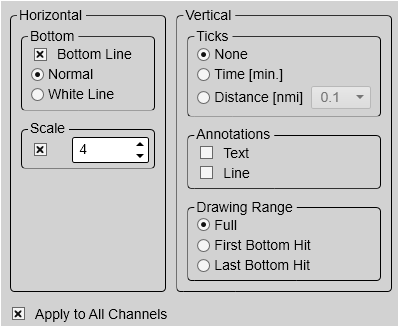
Lines page
The Lines page in the ADCP View Settings dialog box controls the horizontal and vertical lines used in the ADCP views. You can make the bottom easier to see, and add lines that hold additional information. You can also change the vertical scale of the ADCP views. If you wish to add annotations to your ADCP views you can enable them on this page.
Prerequisites
This dialog box is available only when ADCP functionality is activated.
How to open
This page is located in the ADCP View Settings dialog box. The ADCP View Settings dialog box is located on the Active menu.


Description
The settings on the Lines page are all related to visual appearance. The setting(s) you choose will only be valid for the active view. Click in any view to make it active. The active view is identified with a thicker border. Select Apply to All to use the chosen settings on all the ADCP views of the same type.
Details
Bottom
The bottom line can be switched off or on. You can enable a white line to enhance the bottom contour presentation.
Bottom Line
Normal
White Line
This is an "on" switch. A white line can be added to your echogram to enhance the visual bottom detection. It appears as thick line in the current background colour (normally white) that follows the bottom contour. This line will not remove information, it will simply "push" the echo information further down in order to make the bottom
easier to see. You can use the white and the bottom lines simultaneously. Select Normal to disable the line.
Scale
Vertical
These options control vertical markers and annotations.
Ticks
This function places short vertical markers on the top of the echogram. These lines are used to measure time or distance.
| • | None: No vertical markers are shown. |
| • | Time: A short vertical line is drawn in the upper part of the echogram once every minute. |
| • | Distance: A short vertical line is drawn in the upper part of the echogram once every specified number of nautical miles. |
Annotations
Select Text or Line to allow annotation markers to be shown. If you select Line, each text annotation is followed by a vertical line for improved visibility. Annotations can be typed in manually, set up for automatic generation, or imported from an external device.
Tip
Use the Annotations page to type comments and insert annotations into views. Several different annotation types may be added to the echograms or other views. The Annotations page is located in the Installation dialog box.
When you save raw data, the annotations you have defined are stored as annotation datagrams.
Drawing Range
Drawing Range defines the depth range used for the velocity measurement (ADCP) views. This is a visual enhancement. Each of the ADCP beams are set at a fixed angle to the vertical centre line of the ADCP transducer. The beams from the transducer hit the bottom at different ranges due to their different directions and the varying topography
of the sea floor. Water velocity calculations are performed according to the range specified.
| • | Full: Drawing range is specified by the number of samples available. The drawing range in the ADCP views will be the range of the ADCP transducer. This is limited by view range and recording range set in the user interface. |
| • | First Bottom Hit: Drawing range is defined from the vessel to the depth at which the first of the ADCP beams hits the sea floor. |
| • | Last Bottom Hit: Drawing range is defined from the vessel to the depth at which the last ADCP beam hits the sea floor. |