View Selection page
Use the ADCP View Settings dialog box to select the ADCP views you want to see. The View Selection page allows you to choose which views to present, and how to organize them.
Prerequisites
This dialog box is available only when ADCP functionality is activated.
How to open
This page is located in the ADCP View Settings dialog box. The ADCP View Settings dialog box is located on the Active menu.
Description
ADCP data is presented in a dedicated presentation. The View Selection page allows you to choose which views to present, and how to organize them.
Some of the views are numbered according to which beam they represents. The relationship between the numbering and the orientation of the beam they represents can be seen in the Depth pane in the Top bar.
| 1 | Fore Starboard |
| 2 | Aft Port |
| 3 | Aft Starboard |
| 4 | Fore Port |
Tip
If you want to create more ADCP presentations, use the Docking view function to create new ADCP presentations. You can display Correlation views in one ADCP presentation and Geo Velocity view in another presentation. You can display Geo Velocity views using single-ping data in one presentation and in another presentation you can use the Ping Average function to observe differences.
Some of the parameters used in these ADCP views are set elsewhere in the user interface.
| • | Colour scale is set in the Top bar. |
| • | Horizontal scales and lines are set in the ADCP View Settings dialog box |
| • | Units are set in the Installation dialog box. |
Details
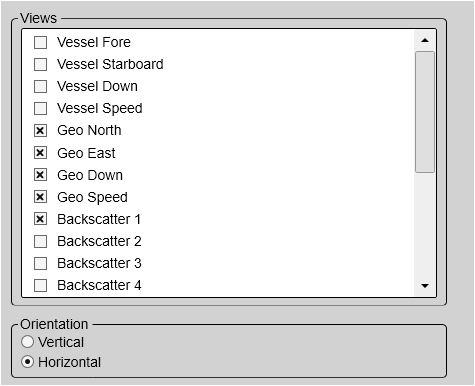
Views
All available ADCP views are listed in this section. Tick the box in front of the view you would like to see in the ADCP presentation.
Vessel Velocity
The Vessel Velocity views display water velocities relative to the vessel. The views display water velocity in fore/aft and port/starboard direction as well as down towards the seafloor. Vessel speed is displayed separately.
Geo Velocity
The Geo Velocity views display water velocity relative to earth coordinates, i.e. water current velocity. The water current velocity is displayed in the cardinal directions (north-south, east-west), as well as velocity down towards
the bottom. Water current speed is displayed in a separate view.
Beam Velocity
The Beam Velocity views display the water velocity along the beam directions. The water is either moving towards or away from the ADCP transducer at the same angle as the vertical orientation of the beam. The Beam Velocity views offers one presentation for each beam.
Backscatter
The Backscatter views present the echo intensity in echograms. There is one Backscatter view for each of the ADCP beams. Backscatter
Correlation
The Correlation views display a measure of the similarity between the received echoes. Correlation is a measure of data quality.
Error Velocity
Error velocity is the difference between two estimates of the vertical velocity. It is an important means to evaluate the data quality. Error velocity will show the magnitude of the errors, not the source.
Percent Good
The Percent Good view displays the percentage of pings which has passed a set of defined quality criteria. The rejection criteria include low correlation and large error velocity. The default threshold is defined in the ADCP Editing dialog box.
Orientation
Horizontal
Vertical
Select Vertical to observe the beams in comparison to each other, or to observe the same phenomenon in several beams.
Vertical orientation mode arranges the views adjacent to each other vertically. This is a useful presentation mode if you want to see snapshots of the complete water column in the four beams adjacent to
each other.