Transducer page
The EK80 system can be set up to work with one or more transceivers. Each transceiver is assigned one or more transducers. By means of the Transducer page you can check the impedance of each transducer during normal operation. Any errors are then easily detected.
How to open
This page is located in the Diagnostics dialog box.

Open the Diagnostics dialog box from the Setup menu.
Description
The transducer impedance is measured in real time during each transmission ("ping"). For CW transmissions, the impedance and phase values for each transducer sector are provided in a tabular format. For LFM transmissions, the results are shown in two plots.
An operational transducer element will have an impedance of approximately 75Ω ±40%. However, various transducers will have different values, and you need to check the relevant data sheet. Composite transducers have a relatively flat impedance curve. Older transducers with "ton-pilz" elements have a slightly higher impedance at the beginning of the ping. This is by design.
The ADCP transceiver/transducer has an impedance in the range 0.1–1Ω. The impedance value is used for the combined transducer/transceiver system.
| • | If you measure ∞Ω (open circuit), you can assume that the transducer impedance transformer has broken, or that the cable is damaged. |
| • | If you measure 0Ω (short), you can assume that either the transducer impedance transformer or the cable has shorted. You may also have a problem with salt water penetration. |
| • | The transducer impedance is a complex value, and it has a phase. This phase should be as small as possible. A large phase means that you loose output power. |
Tip
Each transducer is added using the Transducer Installation page. The Transducer Installation page is located in the Installation dialog box. The Installation dialog box is located on the Setup menu.
LFM (Linear Frequency Modulation) transmissions
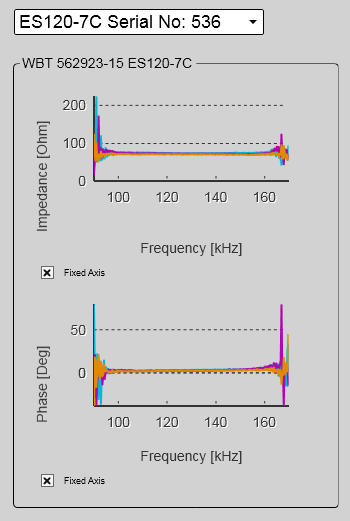
For LFM transmissions, the results are shown in two plots. One plot shows the impedance as a function of the frequency in one ping. The other plot shows the phase as a function of the frequency in the same ping.
In each plot, one coloured curve is provided for each transducer or transducer sector. A single beam transducer is shown with only one curve. A split beam transducer is shown with several curves, one for each sector.
Tip
Select Fixed Axis to make the curves easier to read. Pause the pinging to "freeze" the curves.
If you wish to switch pulse type between CW and LFM, use the Normal Operation dialog box. Before selecting LFM transmissions, make sure that your EK80 system is provided with a compatible transducer!
(The screen capture has been made while using a dummyload.)
CW (Continuous Wave) transmissions
For CW transmissions, the impedance and phase values for each transducer sector are provided in a tabular format.
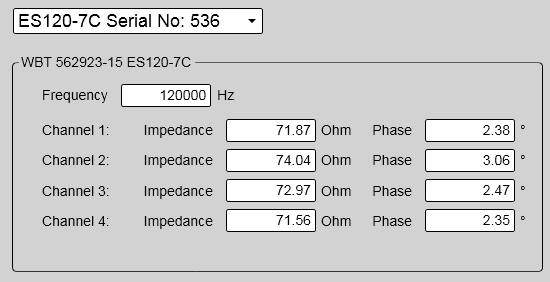
(The screen capture has been made while using a dummyload.)
Details
Impedance
The transducer impedance is measured in real time during each transmission ("ping"). If you measure ∞Ω (open circuit), you can assume that the transducer impedance transformer has broken, or that the cable is
damaged. If you measure 0Ω (short), you can assume that either the transducer impedance transformer or the cable has shorted. You may also have a problem with salt water penetration.
Phase