Calibration Wizard dialog box #5 (Process Data)
The fifth page in the Calibration Wizard allows you to manually "clean" the echo data before you process it to calibrate the EK80. When the processing is finished, you can save the results, and update the calibration data used by the EK80.
Prerequisites
The Calibration Wizard dialog box can only be opened within the calibration process. In order to start the calibration wizard, the EK80 must be in either Normal or Replay mode.
How to open
To open the Calibration Wizard, place the EK80 in either Normal or Replay mode, and select Calibration on the Setup menu.

In the first Calibration Wizard dialog box, select New calibration from raw data (Real time or Replay). This opens page 2. In the second page of the Calibration Wizard dialog box, select the channel to calibrate and select Next at the bottom of the page. This opens page 3. In the third page of the Calibration Wizard dialog box, select the sphere to calibrate for and select Next at the bottom of the page.This opens page 4.
At the bottom of the fourth Calibration Wizard dialog box, save the recorded calibration data. Then, select Next.
If you select Reprocess previous calibration data on the first page of the Calibration Wizard, selecting Next will take you straight to this fourth page.
Description
The fourth page of the Calibration Wizard dialog box is divided into three fields.
Tip
To change the size of the individual field, click and drag the field borders. You can also increase the size of the dialog box. To make the dialog box cover the entire screen, double-click the title bar.
| • | Target Position field The left side of the Target Position field shows all the individual echoes that are imported into the calibration program. All echoes are placed inside a circle to reflect their locations in the beam. The right side of the field shows the calibration layer that is automatically created once the calibration starts.
|
| • | Frequency/Target Strength field The Frequency/Target Strength field shows a curve reflecting the target strength of the sphere for individual frequencies. This is the same curve as you can see in the Calibration Wizard dialog box page four, but with a few additional features.
|
| • | Numerical field The Numerical field provides several tabbed pages.
|
Target Position field
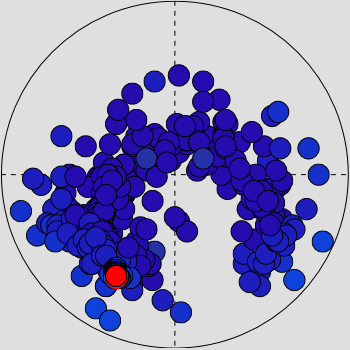
The left side of the Target Position field shows all the individual echoes that are imported into the calibration program. All echoes are placed inside a circle to reflect their locations in the beam. The echoes are compensated for their positions within the beam, so that echoes from the outer edge appear with the same echo
strength as those in the middle of the beam.
| • | When you calibrate for CW (continuous wave), the outer border of the beam model signifies a 3 dB loss. |
| • | In FM calibrations, additional circles (dotted lines) are added to signify the upper and middle frequencies. |
If you select a single echo on the TS Data list, the relevant echo is shown with a red colour in the Target Position field. In the TS Data list, you can suspend individual echoes from the calibration processing. Such echoes would typically be located outside the beam, and they are easy to spot in the graphic presentation.
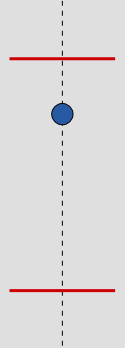
The right side of the field shows the calibration layer that is automatically created once the calibration starts. You can see how each individual echo is received within the calibration layer. This calibration layer is automatically established
when the Calibration Wizard is started. Its purpose is to remove echoes over and below the calibration target(sphere). You can easily see the layer in
the echogram, as it is identified with two red horizontal lines. If you see that many echoes are in fact falling outside the layer, you can adjust its size by clicking on the red lines and
moving them up or down. The red lines in the echogram will be moved accordingly, but the lines in the Target Position field will assume their original position once you release the mouse button.
Frequency/Target Strength field
The Frequency/Target Strength field shows a curve reflecting the target strength of the sphere for individual frequencies. The field is located below the Target Position field.
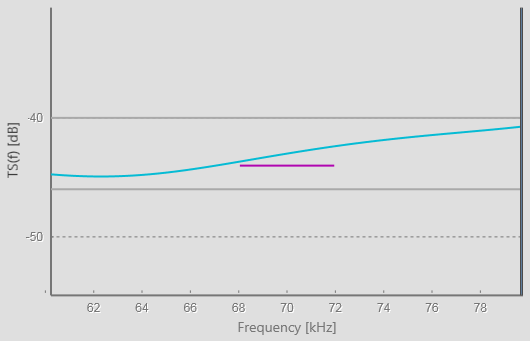
The Frequency/Target Strength field shows the relationship between the frequency and the target strength for the sphere in current use.
| • | The blue line represents the relationship curve. |
| • | The two grey lines reflect the limits that were defined by the TS Deviation setting on the previous page. |
| • | The purple line reflects the bandwidth of the current "ping". The bandwidth is inverse proportional with the pulse length. |
Numerical field
This field is located on the right side of the Calibration Wizard dialog box. The Numerical field provides several tabbed pages.
| • | The General page shows the common data and parameters for the system. Calibration: System information Transceiver parameters common to all beams |
| • | The Channel Data page displays numerical parameters related to the transceiver channel that was used to record the echo data. When you calibrate in FM, the page also offers curves to monitor the gain, the beamwidth and the beam offset as a function of the operating frequency. |
| • | The TS Data page displays the numerical parameters related to each individual echo. If you select a single echo on the TS Data list, the relevant echo is shown with a red colour in the Target Position field. |
| • | The Results page displays the numerical parameters that are created by the calibration processing. |
| • | The Error Analysis page displays all the individual echoes that are imported into the calibration program. Each echo is shown using a colour to indicate the individual target strength. |
Suspending individual echoes
In the TS Data list, you can suspend individual echoes from the calibration processing. Such echoes would typically be located outside the beam, and they are easy to spot in the graphic presentation.
To find the echoes you wish to suspend, select the top row in each table column to sort the content.
You can also select a single echo in the Target Position field. The corresponding row in the TS Data list will be shown with a grey background colour.
To remove a single echo from the calibration processing, select Suspended in the left column. The chosen echo changes to white colour in the Target Position field.
Results page
The Results page displays the numerical parameters that are created by the calibration processing.
Different results are offered for CW and FM calibration.
| • | After an FM calibration, the results are provided as graphs for beam offset, beam width and gain. |
| • | After a CW calibration, the results are provided as list that also includes offset and sA correction. |
Note
The sA correction is only calculated for CW transmissions.
| • | When calibrating a Wide Band Transceiver (WBT), the effective pulse duration is calculated and used to establish the sA correction. This will normally result in a sA correction around 0 dB. |
| • | When calibrating a General Purpose Transceiver (GPT), the sA correction is based on the nominal pulse duration. This will normally result in a slightly negative sA correction. |
Error analysis
The Error Analysis page displays all the individual echoes that are imported into the calibration program.
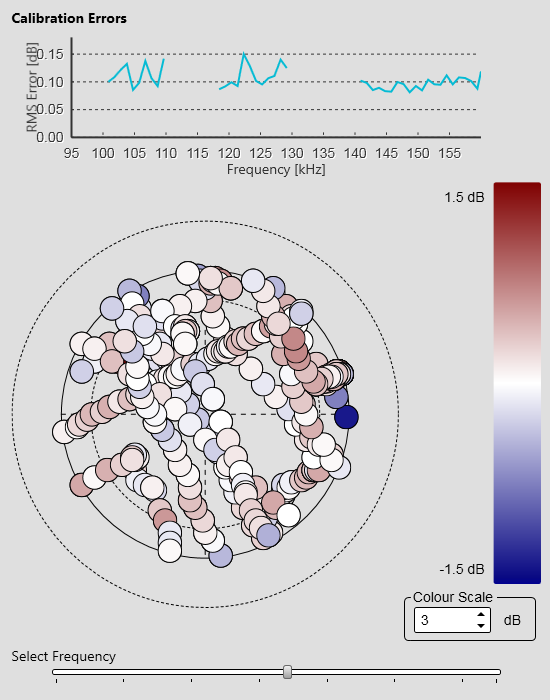
The error analysis is based on an estimated target strength value from your calibration sphere. This estimate is based on
the sphere parameters, the depth and the operational frequency. Each echo is shown using a colour to indicate the individual target strength. This allows you to locate echoes that are stronger or weaker than the estimated target strength.
You can change the colour scale to increase or decrease the resolution.
| • | In CW, the error value is presented in dB, and reflects the difference between the strongest and weakest echo. Ideally, this difference should be as small as possible. |
| • | When you calibrate in FM, an extra curve is added to reflect the calibration errors. The curve presents the error (in dB) as a function of the operational frequency. At the bottom of the page, you can select which frequency to use. |
Details
Reprocess
Select Reprocess to start the calibration processing The function stops automatically. You can calibrate as many times as you like.
Save/Save As
Select Save or Save As to save the calibration data. You are not saving raw echo data here, but an XML file that contains the information necessary to run the calibration process.
Calibration Description
Select this option to open the Calibration Description dialog box.It is always useful to document your calibration for future references. The Calibration Description dialog box allows you to record information about your current calibration operations. The information is saved in the XML file.
Finish
Select Finish to terminate the calibration process. The calibration results are automatically implemented by the EK80 program.
Select Save or Save As to save the calibration data.
Update the calibration used by the echo sounder using Merge or Replace.
| • | These options are not valid for CW calibration. In CW, several sets of calibration values are saved, one for each pulse duration. |
| • | When you calibrate with FM pulses, use Merge or Replace as follows:
In FM, one single set of calibration values is saved, and this set covers all pulse durations.
|
Related tasks
Related dialog boxes