1511OC Fall CalCOFI cruise on RV Oceanus; 28 Oct – 13 Nov 2015; 68 stations (61 standard & 7 SCCOOS) successfully occupied. Five stations on the first two southern lines – stations 93.3 100, 110, 120 & stations 90.0 110, 120 – were cancelled due to bad weather. Station 93.3 50 was initially missed due to bad weather but occupied during the transit home, as station #69. Net tows on stations 86.7 45 & 93.3 45 were initially missed due to high winds but performed during the southward transit home. Second CTD casts, without seawater sample collection, were performed on these two net tow stations. Because the seas were consistently rough, the stations were reordered to allow work to continue. Please refer to the final track map below for the order occupied. Although visually confusing, the track northward from 86.7 45.0 was after its occupation as station #31. Station 86.7 45.0 was re-occupied during the southward transits as station #68 to recover missed net tows.
Please note: these data are 1m-bin-average Seasoft-processed CTD data that have not gone through quality control checks or bottle corrections. Anomalies are based on 50-year harmonics (1949-1999).
10 meter Preliminary CTD Data Contours
(Click for larger image)
10 meter Anomaly Contours (50 yr mean)
(Click for larger image)
100 meter Preliminary CTD Data Contours
(Click for larger image)
100 meter Anomaly Contours (50 yr mean)
(Click for larger image)
Line 80 Vertical Plots
(Click for larger image)
Line 90 Vertical Plots
(Click for larger image)
CTD Processing Notes
CTD Sensor Corrections:
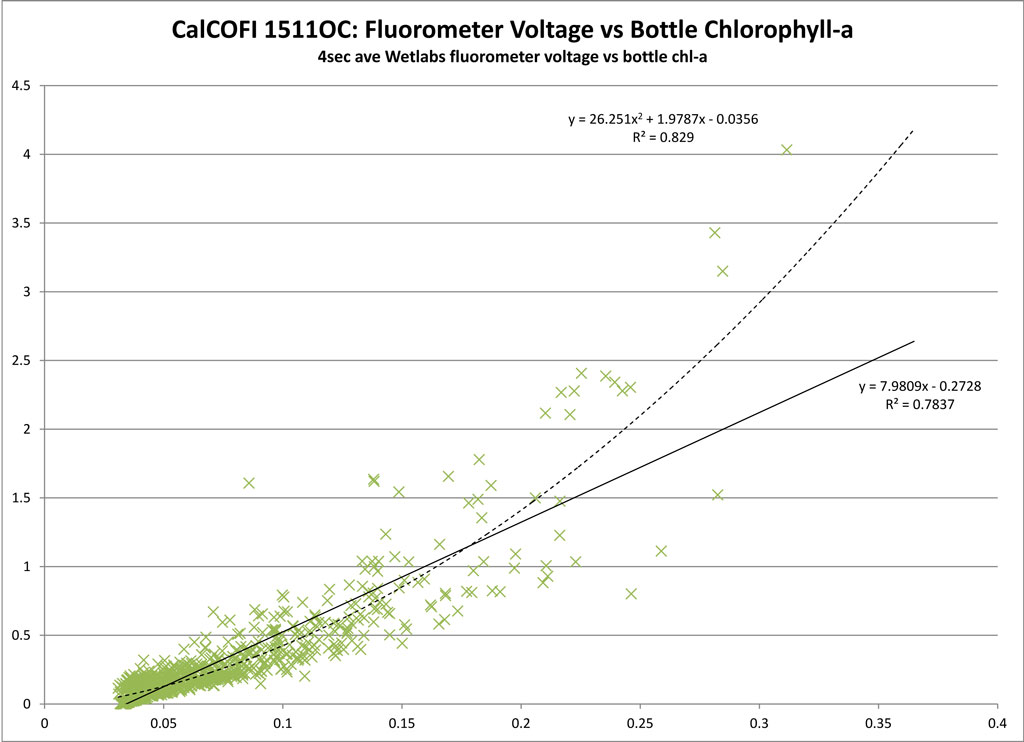
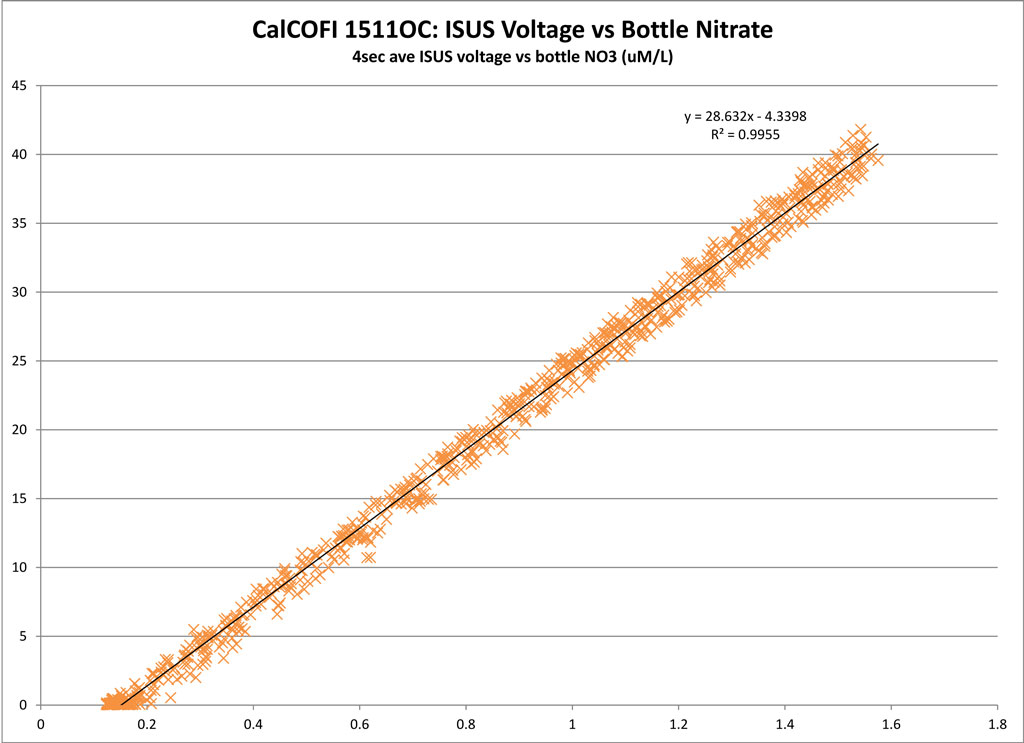
Derived by comparing sensor data (4 sec avg prior-to-bottle closure) to bottle samples.
Dual Salinity (Seabird SBE4) and Oxygen (Seabird SBE43) Sensors
PRIMARY SENSOR
SECONDARY SENSOR
Salinity offset (bottle - sensor; > 350 m)
-0.00235
0.00061
Oxygen ml/L
y =1.0353x - 0.0064;
R² = 0.9998
y = 1.0632x - 0.026; R² = 0.999
Oxygen umol/Kg
y = 1.0369x - 0.1339; R² = 0.9998
y = 1.0648x - 0.9879; R² = 0.999
Single Nitrate (Satlantic ISUS v3 SN111) and Fluorescence (Wetlabs ECO AFL/FL) Sensors
LINEAR
POLYNOMIAL
Nitrate
y = 28.632x - 4.3398; R² = 0.9955
Please note: the ISUS was rebuilt prior to this cruise so early data may display lamp "burn-in". Sta-corrected estimated nitrate should be good.
Fluorescence
y = 7.9809x - 0.2728; R² = 0.7837
y = 26.251x² + 1.9787x - 0.0356;
R² = 0.829
Regressions:
Please note: these regressions are generated from preliminary CTD vs bottle data and will be reprocessed once final bottle data are available. CTD temperatures and salinities do not usually change but oxygen, chlorophyll-a, and nitrate may change significantly after QAQC. Questionable or mistrip bottle data are removed from these comparisons but may be visible on the CTD.csv plots. For this cruise and future cruises, both primary & secondary sensor profiles vs bottle data will be generated and archived in the downloadable CTD+Bottle data files. These plots are under the “csv-plots\Primary” & “csv-plots\Secondary” subdirectories.
General Notes
CalCOFI 1511OC General Cast Notes: Near surface sensor data on casts 16 & 17 are bad. A faulty cable was replaced on cast 18. Also there were “pump off” issues at the start of casts 019-021.