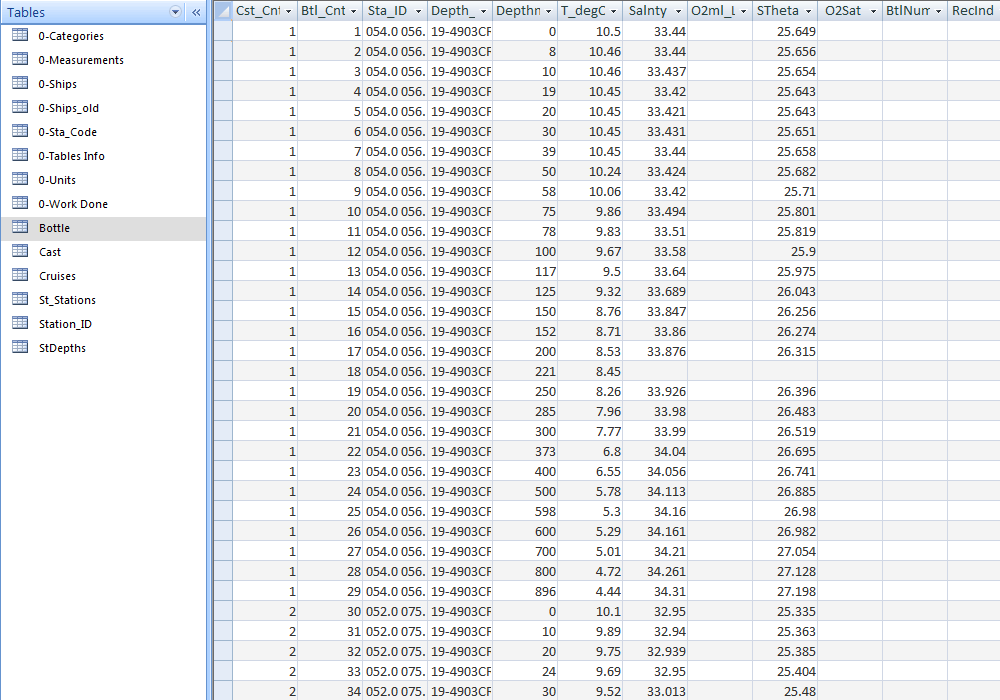
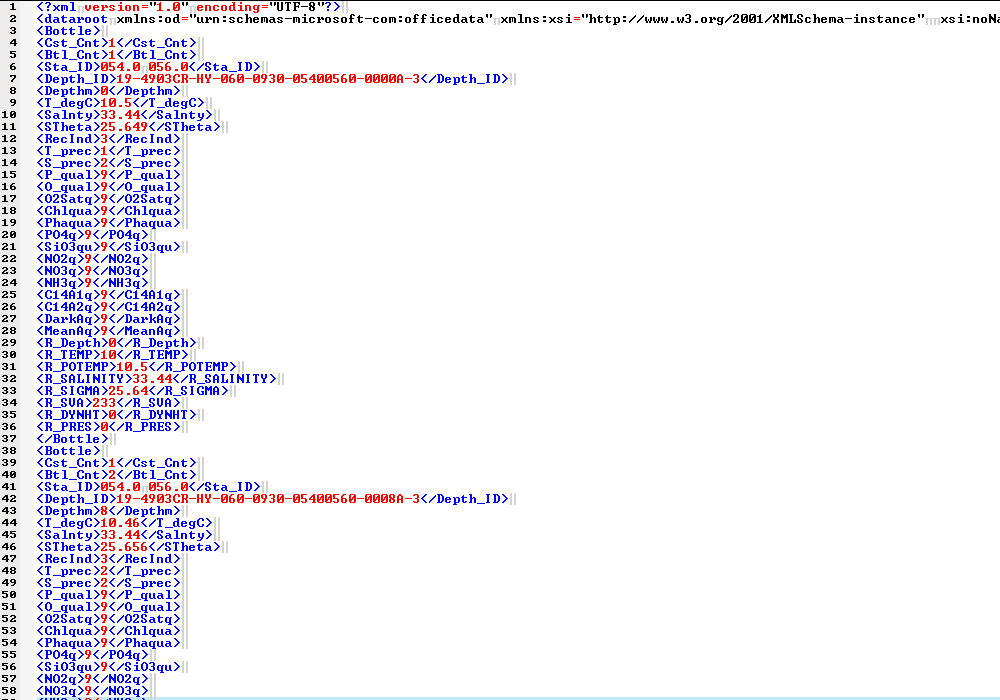
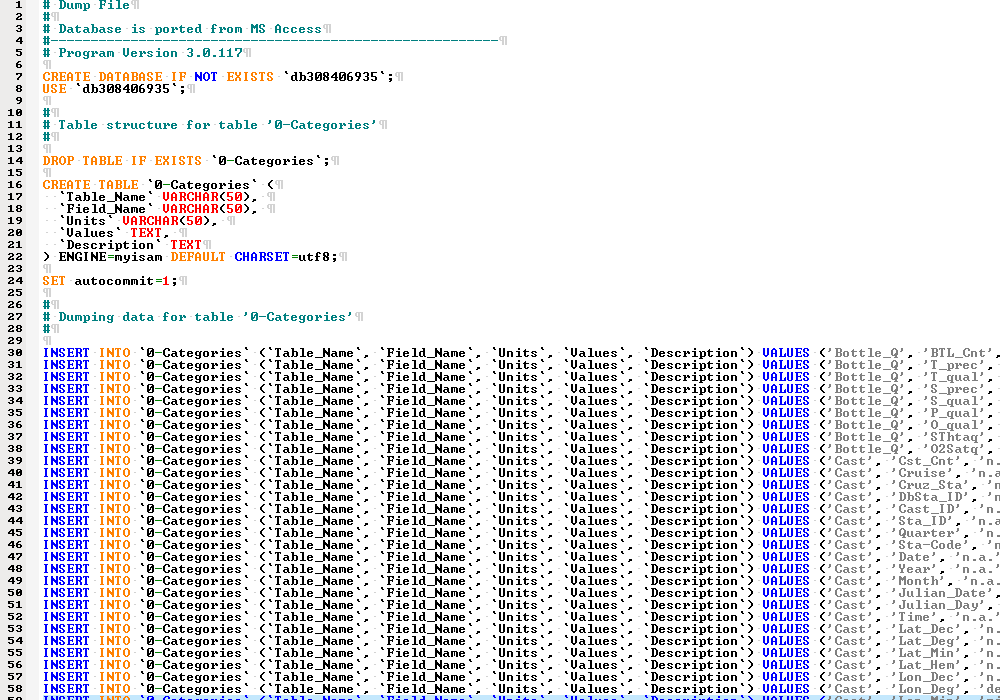
Bottle Database

Oceanographic data collected from chemical analyses of seawater samples (1949 - present)

Overview

This database contains oceanographic data measured from seawater samples collected at CalCOFI stations. Oceanographic data (i.e. the physical features of seawater) includes parameters such as temperature, salinity, dissolved oxygen, chlorophyll-a, nutrients, and many more. The Bottle Database spans the entire timeseries – from 1949, when CalCOFI was initiated, to the present. The database is available in four different formats and can be downloaded below.

History of CalCOFI Seawater Sample Collection

Prior to 1993, CalCOFI collected seawater samples using Niskin, Nansen, and “Wally” (in-house design by Walt Bryant & George Anderson) bottles with reversing thermometers. In 1990, CalCOFI began using a CTD-Rosette (pictured here underwater), and starting Aug 1993 (9308NH) CTD-Rosette sampling became the primary method of seawater collection.

Seawater Collected

Seawater is collected from various sampling depths using 10-liter Niskin bottles attached to a 24-place CTD-Rosette frame

Samples Analyzed

Environmental parameters are measured using chemical analyses (i.e. titrations and assays) from the seawater samples

Data Compiled

Data are QC'ed and compiled in the Bottle Database that can be downloaded here in four formats (CSV, MDB, XML, and SQL)

Database Description

Each file available for download includes two tables:

  • The Cast table contains metadata. This table includes date, time, latitude, longitude, weather, etc. for each CTD cast ever completed on a CalCOFI cruise. Each row is a unique cast, numbered sequentially/indexed by the "Cst_Cnt" column.

  • The Bottle table contains oceanographic data. This table includes oceanographic measurements for each bottle/sampling depth ever completed on a CalCOFI cruise. There are additional data code and precision columns describing the quality of each oceanographic measurement. Each row is a unique bottle/sampling depth, numbered sequentially/indexed by the "Btl_Cnt" column.

    • This table is much larger than the Cast table because each cast can have up to 24 bottles/sampling depths.

    • The Bottle table also has a “Cst_Cnt” column, which can be used as a unifier between the two tables.

See below for a key with descriptions and units of each column/field. 


Sta_Code (Station Codes - found in Cast table)

  • "ST" - Standard CalCOFI Station
  • "SCO" - SCCOOS nearshore/20m Station
  • "NRO" - Not Regularly Occupied Original CalCOFI Station
  • "OCO" - Occasionally CalCOFI Occupied
  • "IMX" - IMECOCAL Occupied
  • "NST" - Non-Standard Station
  • "MBR" - MBARI Occupied Station

Data_Type (Data Type - found in Cast table)

  • "PR" - Productivity Cast
  • "HY" - Hydrographic Cast
  • "10" - Ten-meter Cast
  • "CT" - Compressed CTD Cast (Low Resolution)
  • "MX" - Mixed CTD and Bottle Data

_qual, qua, or q (Quality Code - found in Bottle table; associated with discrete samples; examples: "O_qual", "Chlqua", "PO4q")

  •  Blank - Data OK
  • "4" - Value zeroed due to value below detection limit
  • "6" - Data taken from CTD sensor
  • "8" - Technician thinks value is suspect
  • "9" - Missing Data

RecInd (Record Indicator - found in Bottle table)

  • "3" - Observed Data
  • "4" - Educated office guess (ghost)
  • "5" - Data from STD or CTD sensor
  • "6" - Duplicate Depth
  • "7" - Interpolated to a standard depth

Download Bottle Database Here:

Field Descriptions

Keys providing descriptions and units for each column/field in Cast and Bottle tables

Key: Cast Table

Field NameUnitsDescription
Cst_Cntn.a.Cast Count - All CalCOFI casts ever conducted, consecutively numbered
Cruise_IDn.a.Cruise identifier [Year]-[Month]-[Day]-C-[Ship Code]
Cruisen.a.Cruise Name [Year][Month]
Cruz_Stan.a.Cruise Name and Station [Year][Month][Line][Station]
DbSta_IDn.a.Line and Station
Cast_IDn.a.Cast Identifier [Century] - [YY][MM][ShipCode] - [CastType][Julian Day] - [CastTime]-[Line][Sta]
Sta_IDn.a.Line and Station
Quartern.a.Quarter of the year
Sta_Coden.a.Station Designation (See Station_ID and 0-St_Code for codes)
Distancenautical milesNautical miles from coast intercept, calculated from estimated latitude and longitude
DatetimeDate (Month Day Year)
Yearn.a.Year
Monthn.a.Month
Julian_Daten.a.OA Date: days since December 30, 1899
Julian_Dayn.a.Julian Day of the year
TimetimeTime (UTC) CTD reached terminal depth
Lat_Decdecimal degreesObserved Latitude in decimal degrees
Lat_DegdegreesObserved Latitude in degrees
Lat_MinminutesObserved Latitude in minutes
Lat_Hemn.a.Observed Latitude Hemisphere
Lon_Decdecimal degreesObserved Longitude in decimal degrees
Lon_DegdegreesObserved Longitude in degrees
Lon_MinminutesObserved Longitude in minutes
Lon_Hemn.a.Observed Longitude Hemisphere
Rpt_Linen.a.Reported Line Number
St_Linen.a.Nearest Standard Line
Ac_Linen.a.Calculated actual line from observed latitude and longitude
Rpt_Stan.a.Reported Station Number
St_Stationn.a.Nearest Standard Station Number
Ac_Stan.a.Calculated actual station from observed lat and long
Bottom_DmetersBottom depth in meters
Ship Namen.a.Ship's Name
Ship Coden.a.Ship's NODC Code
Data_Typen.a.Data Type
Order_Occn.a.Order station was occupied (within each cruise)
Event_Numn.a.Event number; includes all research opperations within each cruise (e.g. nets, CTD)
Cruz_Legn.a.Leg of cruise, if multiple legs
Orig_Sta_IDn.a.IEH Reported Station ID
Data_Orn.a.
Cruz_Numn.a.Cruise Designation (Year Month)
IntChlmilligrams chl per square meter per half light dayIntegrated Chlorophyll per half light day
IntC14milligrams C per square meter per half light dayIntegrated Primary Productivity per half light day
Inc_StrtimeIncubation Start Time (PST)
Inc_EndtimeIncubation End Time (PST)
PST_LANtimeTime of Local Apparent Noon (PST)
Civil_TtimeTime of Civil Twilight (PST)
TimeZonen.a.Time Zone
Wave_DirdegWave Direction reported using an abbreviated 360° azimuth circle with 00 representing True North, 18 represents 180°
Wave_HtfeetWave Height in feet
Wave_PrdsecondsWave Period in seconds
Wind_DirdegreesReported using an abbreviated 360° azimuth circle with 0 representing True North, 18 representing 180°
Wind_SpdknotsWind Speed in knots
BarometermillibarsMillibars to the tenths
Dry_Tdegrees CelciusDry Air Temperature from a Sling Psychrometer in degrees Celcius
Wet_Tdegrees CelciusWet Air Temperature from a Sling Psychrometer in degrees Celcius
Wean.a.1 Digit Code from The World Meteorlogical Organization, Code source WMO 4501
Cloud_Typn.a.1 Digit Code from The World Meteorlogical Organization, Code source WMO 0500
Cloud_Amtn.a.1 Digit Code from The World Meteorlogical Organization, Code source WMO 2700, in oktas
Visibilityn.a.1 Digit Code from The World Meteorlogical Organization, Code source WMO 4300
SecchimetersSecchi disk depth in meters
ForelUForel-Ule ScaleWater color; Only used in CalCOFI dataset from 1988-10 through 1998-04

Key: Bottle Table

Field NameUnitsDescription
Cst_Cntn.a.Cast Count - All CalCOFI casts ever conducted, consecutively numbered
Btl_Cntn.a.Bottle Count - All CalCOFI bottles ever sampled, consecutively numbered
Sta_IDn.a.Line and Station [Line] [Station]
Depth_IDn.a.Uses the Cast_ID prefix ([Century]-[Year][Month][ShipCode]-[CastType][Julian Day]-[CastTime]-[Line][Sta]) but adds three additional variables: [Depth][Bottle]-[Rec_Ind]
DepthmmetersBottle depth in meters
T_degCdegrees CelsiusWater temperature in degrees Celsius
SalntyPractical Salinity ScaleSalinity (Practical Salinity Scale 1978)
O2ml_Lmilliliters per literMilliliters oxygen per liter of seawater
SThetakilograms per cubic meterPotential Density (Sigma Theta), Kg/M³
O2Satpercent saturationOxygen percent saturation
Oxy_µmol/Kgmicromoles per kilogramOxygen micromoles per kilogram seawater
BtlNumn.a.Niskin bottle sample was collected from
RecIndn.a.Record Indicator (quality code that applies to the whole bottle, instead of just to a specific parameter)
T_precn.a.Temperature Precision
T_qualn.a.Quality Code
S_precn.a.Salinity Precision
S_qualn.a.Quality Code
P_qualn.a.Quality Code
O_qualn.a.Quality Code
SThtaqn.a.Quality Code
O2Satqn.a.Quality Code
ChlorAmicrograms per literMigrograms Chlorophyll-a per liter seawater, measured fluorometrically
Chlquan.a.Quality Code
Phaeopmicrograms per literMicrograms Phaeopigment per liter seawater, measured fluormetrically
Phaquan.a.Quality Code
PO4uMmicromoles per literMicromoles Phosphate per liter of seawater
PO4qn.a.Quality Code
SiO3uMmicromoles per literMicromoles Silicate per liter of seawater
SiO3qun.a.Quality Code
NO2uMmicromoles per literMicromoles Nitrite per liter of seawater
NO2qn.a.Quality Code
NO3uMmicromoles per literMicromoles Nitrate per liter of seawater
NO3qn.a.Quality Code
NH3uMmicromoles per literMicromoles Ammonia per liter of seawater
NH3qn.a.Quality Code
C14As1milligrams C per cubic meter per half light day14C Assimilation of Replicate 1 (milligrams carbon per cubic meter of seawater per half light day)
C14A1pn.a.Precision of 14C Assimilation of Replicate 1
C14A1qn.a.Quality Code
C14As2milligrams C per cubic meter per half light day14C Assimilation of Replicate 2 (milligrams carbon per cubic meter of seawater per half light day)
C14A2pn.a.Precision of 14C Assimilation of Replicate 2
C14A2qn.a.Quality Code
DarkAsmilligrams C per cubic meter per half light day14C Assimilation of Dark/Control Bottle (milligrams carbon per cubic meter of seawater per half light day)
DarkApn.a.Precision of 14C Assimilationof Dark/Control Bottle
Darkaqn.a.Quality Code
MeanAsmilligrams C per cubic meter per half light dayMean 14C Assimilation of Replicates 1 and 2 (milligrams carbon per cubic meter of seawater per half light day)
MeanApn.a.Precision of Mean 14C Assimilation of Replicates 1 and 2
MeanAqn.a.Quality Code
IncTimtimeElapsed incubation time of the primary productivity experiment
LightPpercentLight intensities of the incubation tubes in the primary productivity experiment, expressed as percentages
R_DepthmetersReported Depth (from pressure) in meters
R_Tempdegrees CelsiusReported (Potential) Temperature in degrees Celsius
R_SalPractical Salinity ScaleReported Salinity (from Specific Volume Anomoly, M³/Kg)
R_DYNHTdynamic metersReported Dynamic Height in units of dynamic meters (work per unit mass)
R_Nutsmicromoles per literReported Ammonium concentration
R_Oxy_µmol/Kgmicromoles per kilogramReported Oxygen micromoles/kilogram
DIC1micromoles per kilogramDissolved Inorganic Carbon micromoles per kilogram solution
DIC2micromoles per kilogramDissolved Inorganic Carbon micromoles per kilogram solution (on a replicate sample)
TA1micromoles per kilogramTotal Alkalinity micromoles per kilogram solution
TA2micromoles per kilogramTotal Alkalinity micromoles per kilogram solution (on a replicate sample)
pH1pH scalepH (the degree of acidity/alkalinity of a solution)
pH2pH scalepH (the degree of acidity/alkalinity of a solution) on a replicate sample
DIC Quality Commentn.a.Quality Comment

Looking for CTD sensor data?

In addition to our Bottle Database containing measurements derived from seawater samples, CalCOFI also provides raw and 1-m bin-averaged CTD sensor data for each cruise from 1990 to present.