PRIMARY PRODUCTIVITY
1. Principle
Seawater samples are incubated with a radioactive substrate to determine the incorporation of inorganic carbon into particulate organic carbon due to photosynthesis at selected light levels. The data have units of mg-carbon per m3 per half day.
2. Productivity Cleaning Procedures
|
2.1. |
Micro-90 Cleaning solution is diluted to 2% solution using de-ionized water (DW). Hydrochloric acid (HCl) Trace Metal Grade, Fisher Scientific, solution (1.2M) diluted with DW. Acid-washing of Teflon should be done with great care as Teflon is porous to HCl which can compromise dilute basic stock solutions of 14C -bicarbonate. |
|
2.2. |
250 ml polycarbonate incubation bottles are filled to capacity with 2% MICRO for 3 days with the cap on in an inverted position. Next, rinse all Micro away and then rinse down the walls with 20 -30mls 10%HCl and recap and shake to acid rinse inside bottle. This should be left overnight 12-16 hours. The acid is removed by rinsing the bottles three times with milliQ clean water before air drying. |
|
2.3. |
10 liter rosette sample bottles are cleaned with a 2% MICRO soak for 3 days, rinsed with de-ionized water and then dipped in 10% metals free HCl. Caps, special coated springs and valve assemblies are also cleaned with a 2% MICRO soak for 3 days and then rinsed with de-ionized water and dried. |
|
2.4. |
All lab ware to be used is cleaned in this manner. |
3. Preparation of Isotope Stock
|
3.1. |
To prevent contamination of self or solutions, work with the isotope stock is performed wearing vinyl gloves. |
|
3.2. |
A solution of 0.3 g of Na2CO3 anhydrous (ALDRICH 20,442-0, 99.995%) per liter Milli-Q filtered DW in a Micro cleaned 1 liter Teflon bottle to yield a concentration of 2.8 mM Na2CO3. This solution is filtered through 0.2µM Nucleapore filter to remove particulate carbonate. |
|
3.3. |
Concentrated stock, 50ml of NaH-14CO3 (~50-57 mCi mmole; MP Biomedicals LLC.) was diluted with 350 ml the 2.8mM Na2CO3 solution in productivity-cleaned 1 liter polycarbonate graduated cylinder. It has become necessary to pH this up with an ultra clean 1N NaOH solution to raise the pH to ~10. |
|
3.4. |
Specific activity can be checked by diluting the above made solution to working concentrations, ie 50-200µl added to 250ml polycarbonate centrifuge bottle and measuring out triplicate 1ml portions into beta ethanolamine spiked (1.5%v/v) Ecolume scintillation cocktail. |
|
3.5. |
To check for 14C-organic carbon contamination another working aliquot of 200µl can be placed into a scintillation vial and acidified with 0.5ml 10% HCl and placed on a shaker overnight. This is done in the hood as it liberates 14C-CO2. The acidified dpm should be <0.0001% of the total dpm of the 14C preparation. |
4. Incubation Systems: situ incubation techniques
|
4.1. |
Incubation apparatus consists of seawater-cooled, temperature monitored incubator tubes wrapped with neutral-density screens which simulate in situ light levels. |
|
4.2. |
Six incubation depths are selected, they represent 56, 30, 10, 3, 1 and ~0.3 % light level. These values are estimated using a wand type PAR meter after cleaning tubes and screens covering them. The near surface light level is reduced to 56% using common plastic screening to prevent a lense effect and subsequent cooking of the surface samples. |
5. Sampling
|
5.1. |
Primary productivity samples are taken each day shortly before local apparent noon (LAN). Light penetration was estimated from the Secchi depth (Using the definition that the 1% light level is three times the Secchi depth). The depths with ambient light intensities corresponding to light levels simulated by near surface and the on-deck incubators were identified and sampled on the rosette up-cast. Extra bottles were tripped in addition to the usual 20 levels sampled in the combined rosette-productivity cast in order to maintain the normal sampling depth resolution. |
|
5.2. 5.3. |
Using a dark sleeve to subdue the light, water samples are transferred to the incubation bottles (250 ml polycarbonate bottles) and stored in a dark box until inoculation. Triplicate samples (two light and one dark control) were drawn from each productivity sample depth. |
6. Isotope Addition and Sample Incubation
|
6.1. |
Samples are inoculated with 50-200 µl of 14C as NaHCO3 stock solution of sodium carbonate (Fitzwater et al., 1982). |
|
6.2. |
Samples are incubated from LAN to civil twilight in a surface seawater-cooled incubators with neutral-density screens which simulate in situ light levels, corresponding to those from which samples were taken (see 4.2). |
|
6.3. |
At civil twilight the incubation is terminated and the time noted. Sea state and safety is the only exception accepted to delay the end time. |
7. Filtration
|
7.1. |
At the end of the incubation, all bottles have subsamples of 10mls removed for DO14C analysis. The LTER DOC filtrate apparatus consists of a plexi-glass filtration manifold to hold up to 18 scintillation vials over which syringe needles with 0.45um equivalent micro-syringe filters can be passed through stoppers with 25 ml syringe bodies serving as filter funnels. The exception to this is dark bottles are only sampled for DO14C on two each high and low chlorophyll stations. |
|
7.2. |
Additionally, from dark bottles a 1ml sample is placed into beta mercapto-ethanol spiked (1.5%v/v) Ecolume scintillation cocktail to determine the specific radioactivity in the samples. These values are used to calculate an average cruise value after removing outliers. |
|
7.3. |
Finally the samples are filtered onto Millipore HA filters and placed in scintillation vials. One half ml of 10% HCl was added to each sample. The samples are then allowed to sit, without a cap, at room temperature for at least 3 hours (after Lean and Burnison, 1979). |
8. 14C Sample Processing
|
8.1. |
After addition of 10mls of Ecolume cocktail, vials are tightly capped and mixed before vials are counted for up to 10 minutes each for 14C on a Beckman 6100LC liquid scintillation counter set to 1.0% counting precision. |
|
8.2. |
Data is captured to a flat file using Beckman data capture software for Windows in ASCII format. This format is then used to integrate productivity depths into the CalCOFI data processing flow. |
9. Calculations
Data is presented as mean mg Carbon assimilated per meter cubed of seawater for one half light day.
mgC/m3 per one half light day = ((Sampledpm – Blankdpm) x W)/R, where
W = 25200 = 12,000 x A x FT x 1.05
12,000= molecular weight of carbon in milligrams
A = carbonate alkalinity (milliequivalents/liter)
FT = Total carbon dioxide content/ carbonate alkalinity
1.05 is the 14C isotope fractionation factor, reflecting preferential use of C12 over C14 by a factor of 5%
R = dpm added to sample (µCi/200µl x 2.2 x 106)
To better understand this equation and variables see Strickland and Parsons (1968).
10. Equipment/Supplies
· 10 liter pri. prod. cleaned sampling bottles · Secchi disk · Re-pipet dispensers for delivering 20µl, 200µl, 0.5ml · Pipets able to measure 1ml and 10ml · 250 ml polycarbonate centrifuge bottles · liquid scintillation counting (LSC) vials · Seawater plumbed incubation rack with neutral density screening. · Par meter, wand type (Biospherical Instruments) · 14C sodium bicarbonate stock solution (MP Biomedicals, LLC) · Millipore Type HA filters (Fisher Scientific) · vacuum filtration system including separate device for DOC filtrate capture · Polycarbonate centrifuge bottles · Teflon laboratory wares · vortex mixer · liquid scintillation counter (LS 6000LC Beckman Instruments, Inc.)11. Reagents
· Milli-Q filtration/anion exchange water purifier · Micro-90 Cleaning solution, Cole Palmer Instrument Co. · HCl for trace metal analysis (Fisher Chemical) · Na2CO3 (99.995%) Aldrich Chemical · NaH-14CO3 solution (cat #17441H MP Biomedicals, LLC.) · 2-amino ethanol (ethanolamine) ACS grade · Aquasol-II (Dupont) · Ecolume (MP Biomedicals, LLC.)12. Re-count check
13. References
· Fitzwater, S. E., G. A. Knauer and J. H. Martin, 1982. Metal contamination and its effect on primary production measurements. Limnol. Oceanogr., 27: 544-551. · Lean, D. R. S. and B. K. Burnison, 1979. An evaluation of errors in the 14C method of primary production measurement. Limnol. Oceanogr., 24: 917-928. · Steeman-Nielsen, E. (1951). \”Measurement of production of organic matter in sea by means of carbon-14\”. Nature 267: 684–685. · Strickland, J. D. H. and Parsons, T. R. 1968. A Practical Handbook of Seawater Analysis pp. 267-278.2511SR
9 – 18 Nov 2025
R/V Sally Ride
San Diego to San Diego
Loading 7 – 8 Nov 2025 (Nimitz Marine Facility)
Offloading 19 Nov 2025 (Nimitz Marine Facility)
2211SR
05 – 20 Nov 2022
R/V Sally Ride
San Diego to San Diego
Loading 03 – 04 Nov 2023 (Nimitz Marine Facility)
Offloading 21 Nov 2023 (Nimitz Marine Facility)

2508SR
18 – 31 July 2025
R/V Sally Ride
San Diego to San Diego
Loading – 16 – 17 July 2025
Offloading – 1 Aug 2025

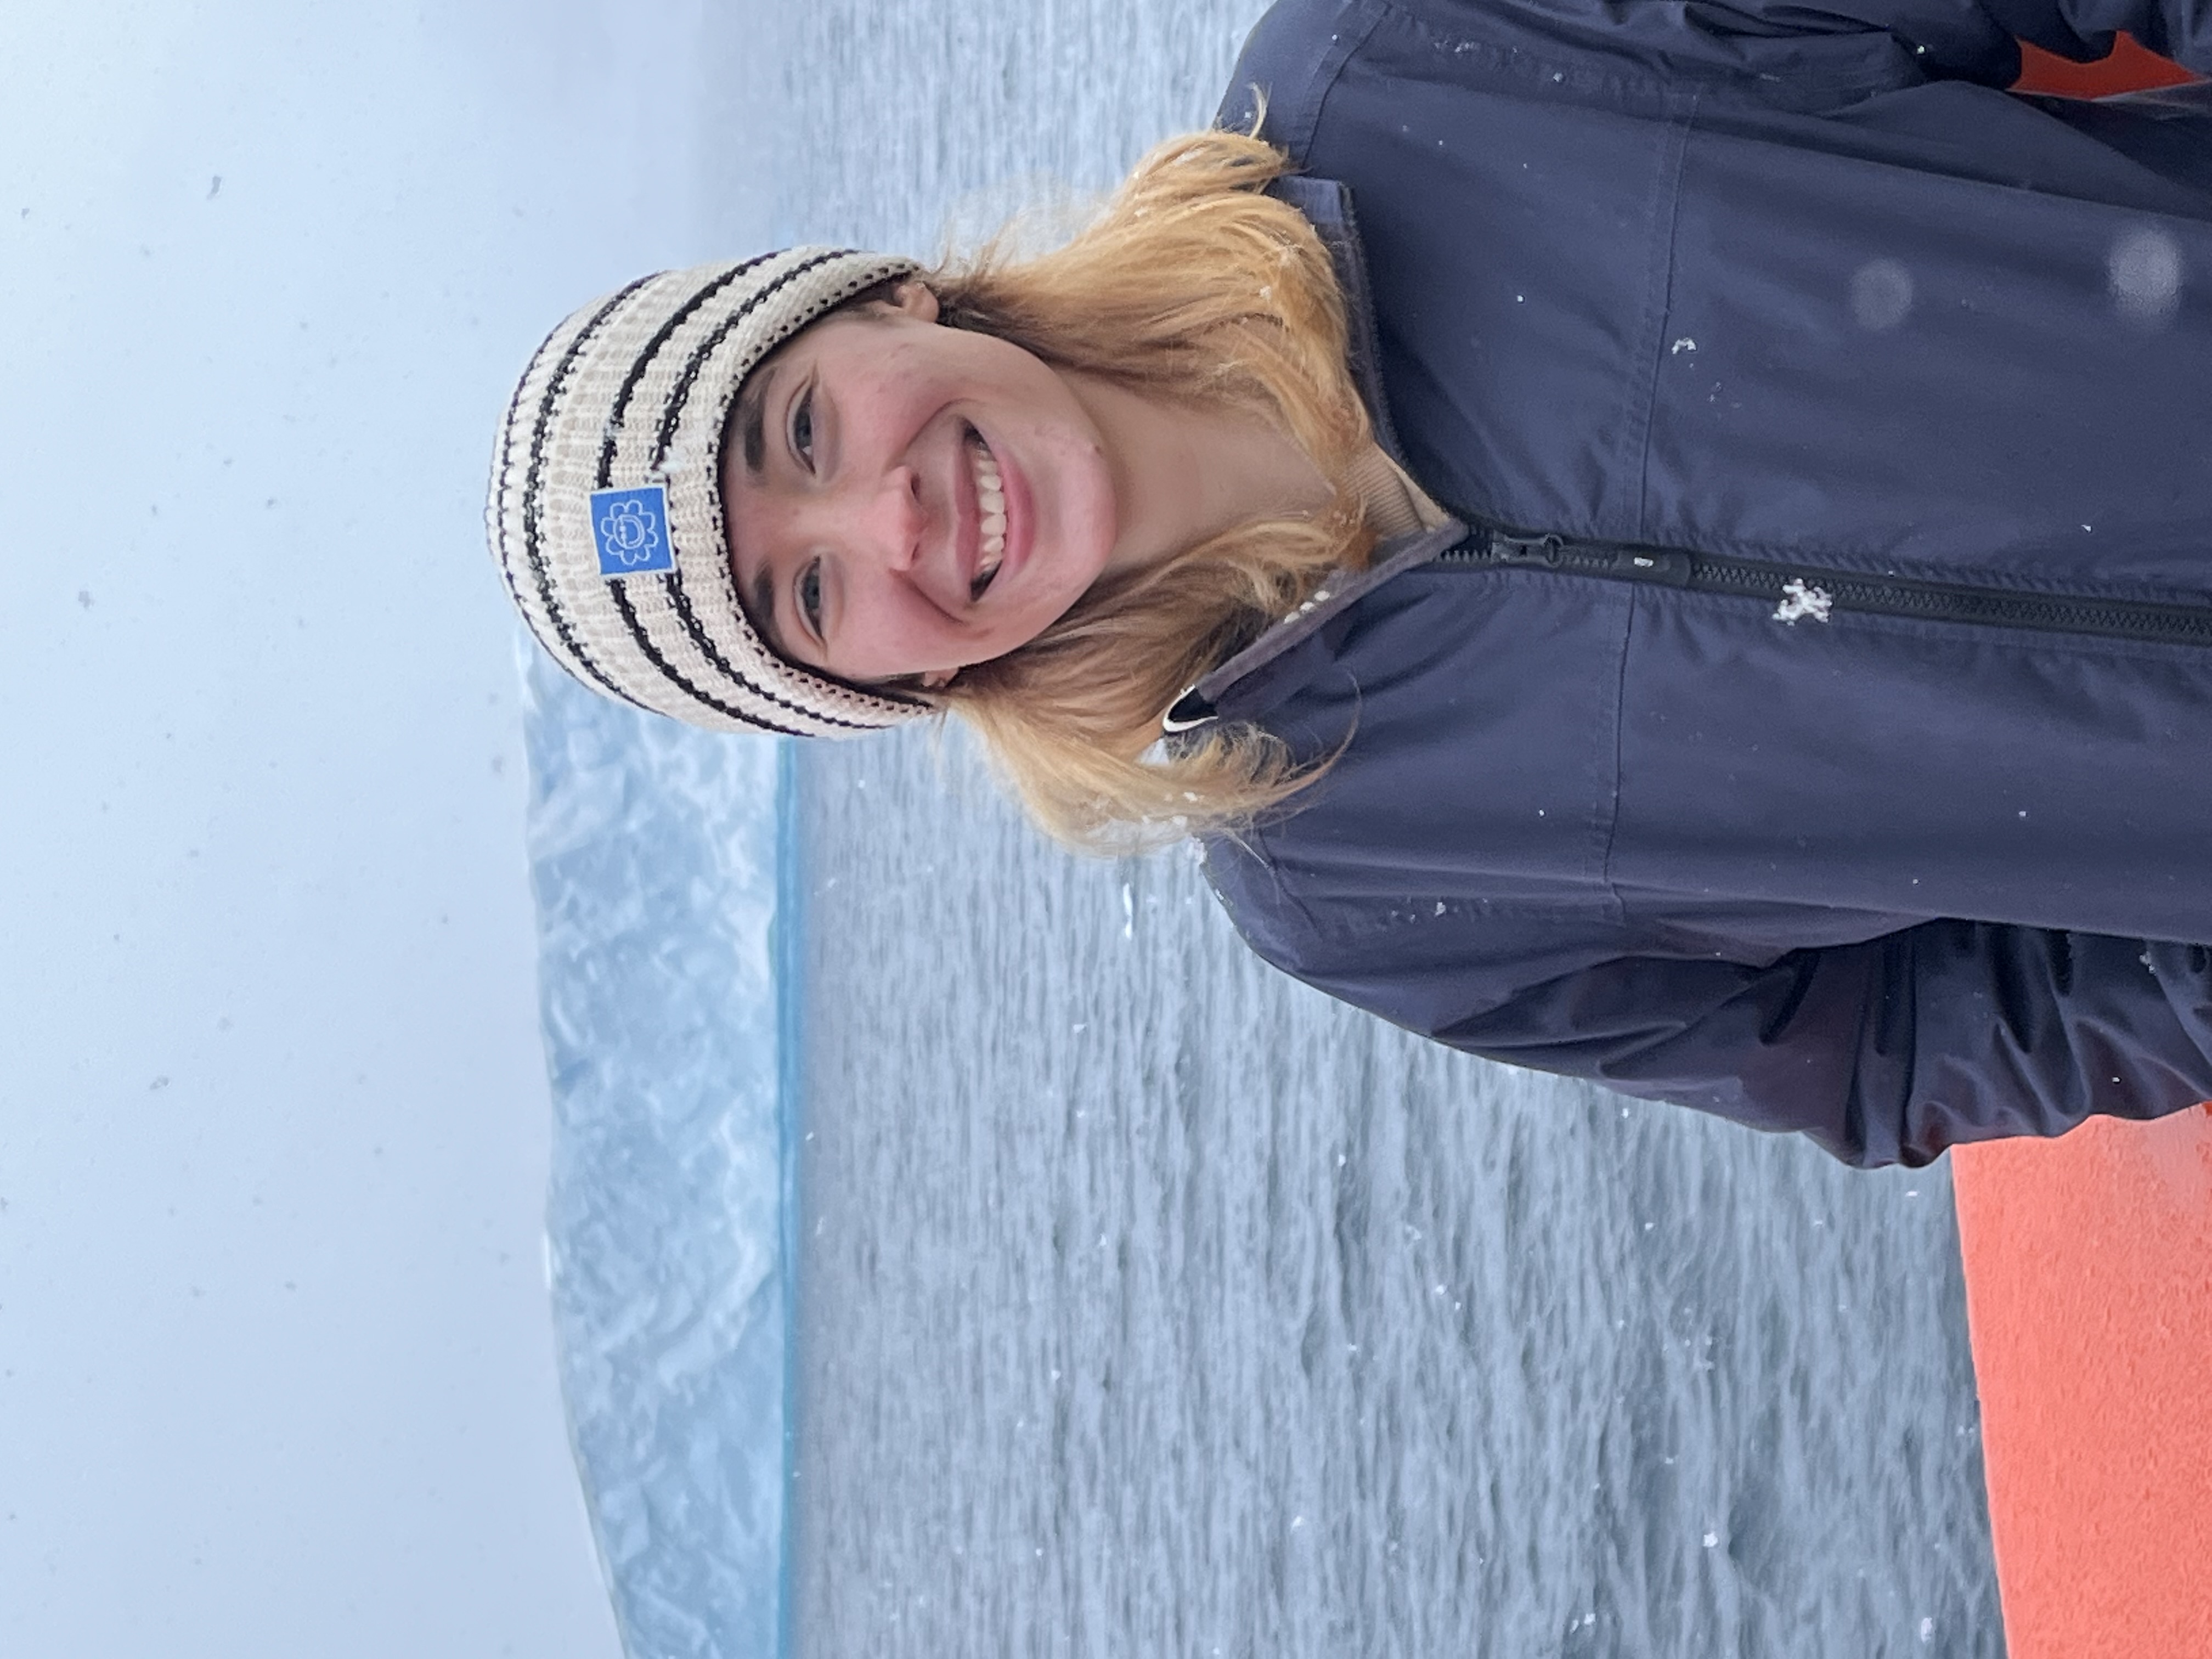
Welcome, Josie Adams, SIO CalCOFI’s new Research Associate
We are excited to welcome Josie Adams to the SIO CalCOFI oceanographic team. Josie is a recent graduate of the University of Washington School of Oceanography, where
2504SH
20 Mar – 21 Apr 2025 (subject to change)
FSV Bell M. Shimada
San Diego to San Francisco
Loading Mar 2025 – Dates TBD (10th Avenue Marine Terminal)
Offloading Apr 2025 – Dates TBD (San Francisco Pier)