CalCOFI 1806SR sailed on RV Sally Ride on 09 Jun 2018 from Nimitz Marine Facility, San Diego. 72 of 75 science stations were successfully occupied. Two SCCOOS stations, 93.4 26.4 & 91.7 26.4, were not scheduled due to conflicting Naval operations. CTD casts and various net tows were completed at each science station. Scheduled unusually early this summer, the weather was moderately-rough for most of the cruise, slowing transits. This resulted in dropping the Pt Dume SCCOOS station on the way home to San Diego. At sta 87.100 (31 39.4N 123 4.2W), RV Sally Ride rendezvoused with trans-Pacific race-support sailboat Present Moment towing abandoned race row boat Anne. RV Sally Ride brought the damaged boat onboard & transported it to San Diego. Details of the recovery of Anne from Present Moment onto R/V Sally Ride can be found on RV Sally Ride’s blog by Melissa Miller. The cruise ended Nimitz Marine Facility, San Diego on 24 Jun 2018.
Please note: these data are 1m-bin-average Seasoft-processed CTD data that have not gone through quality control checks or bottle corrections. Anomalies are based on 50-year harmonics (1949-1999).
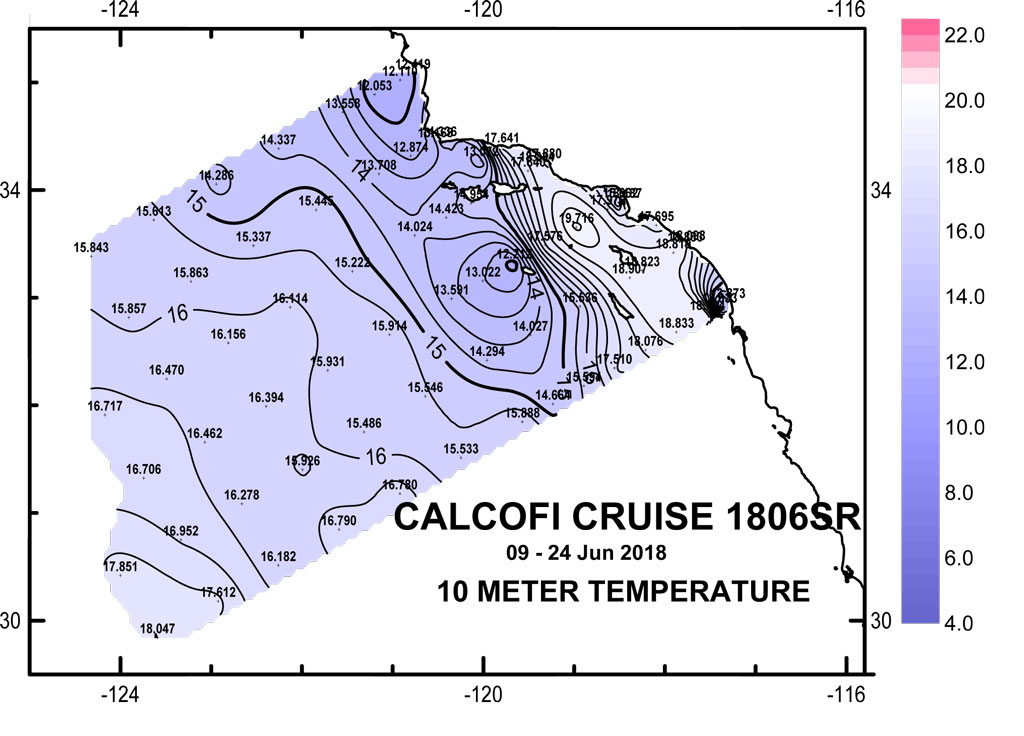
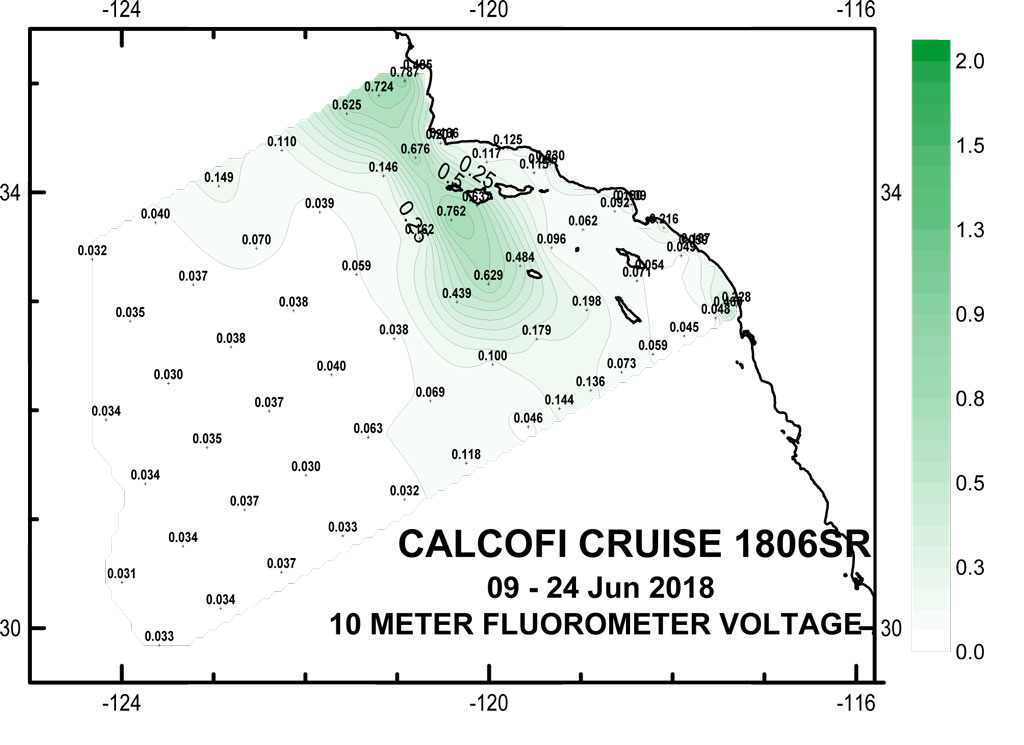
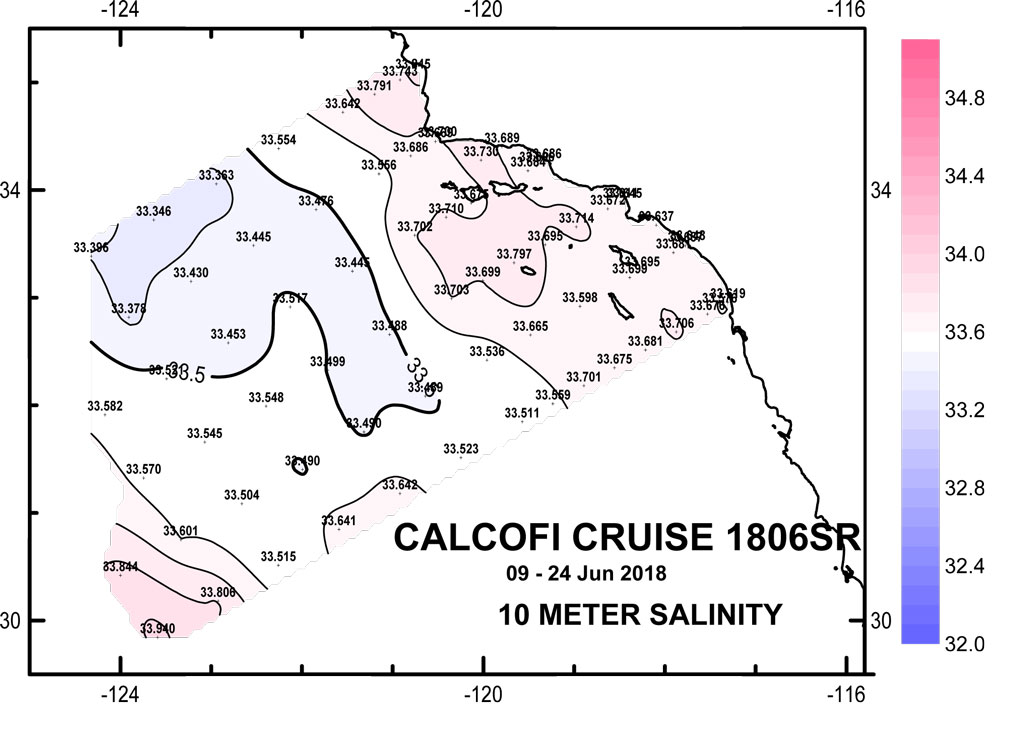
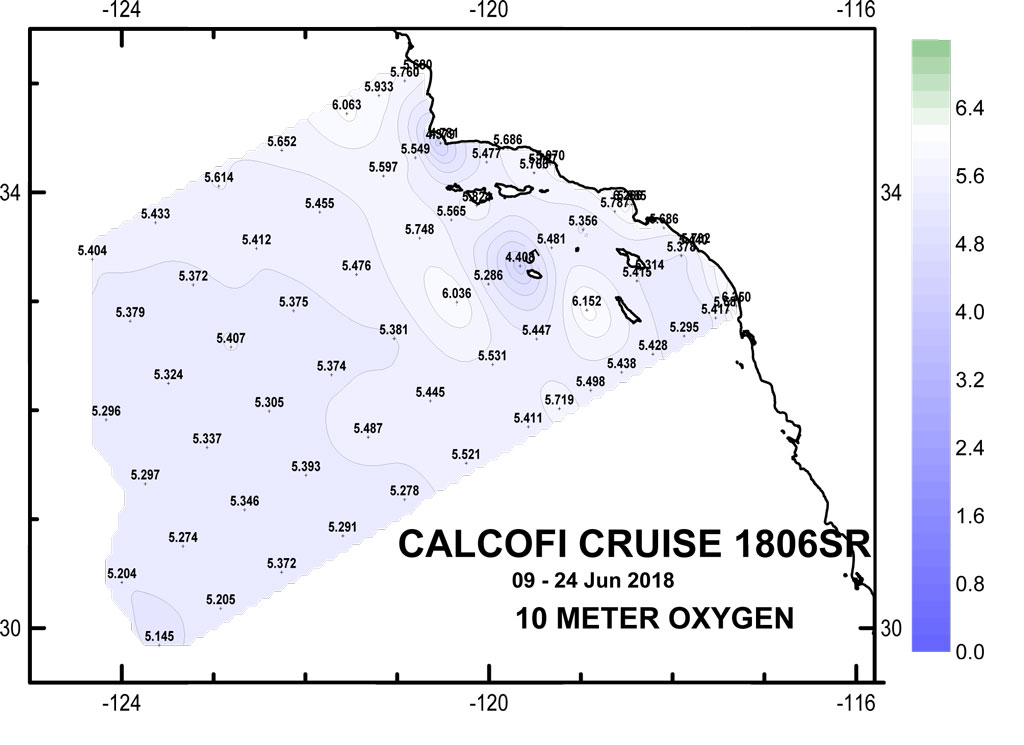
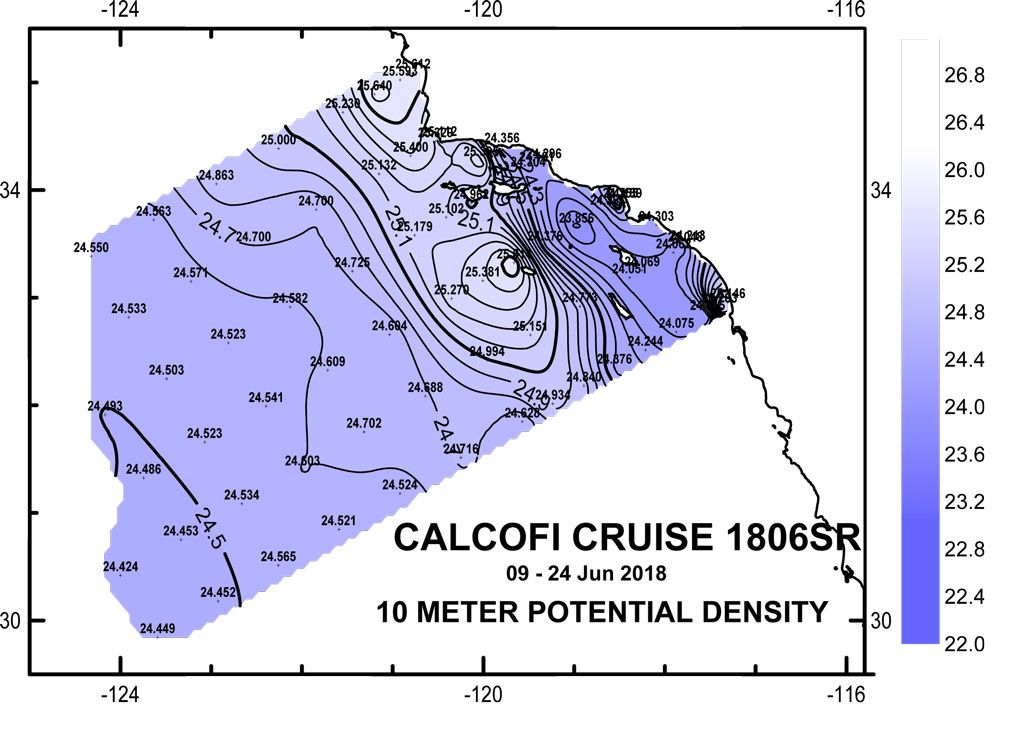
10 meter Preliminary CTD Data Contours
(Click for larger image)
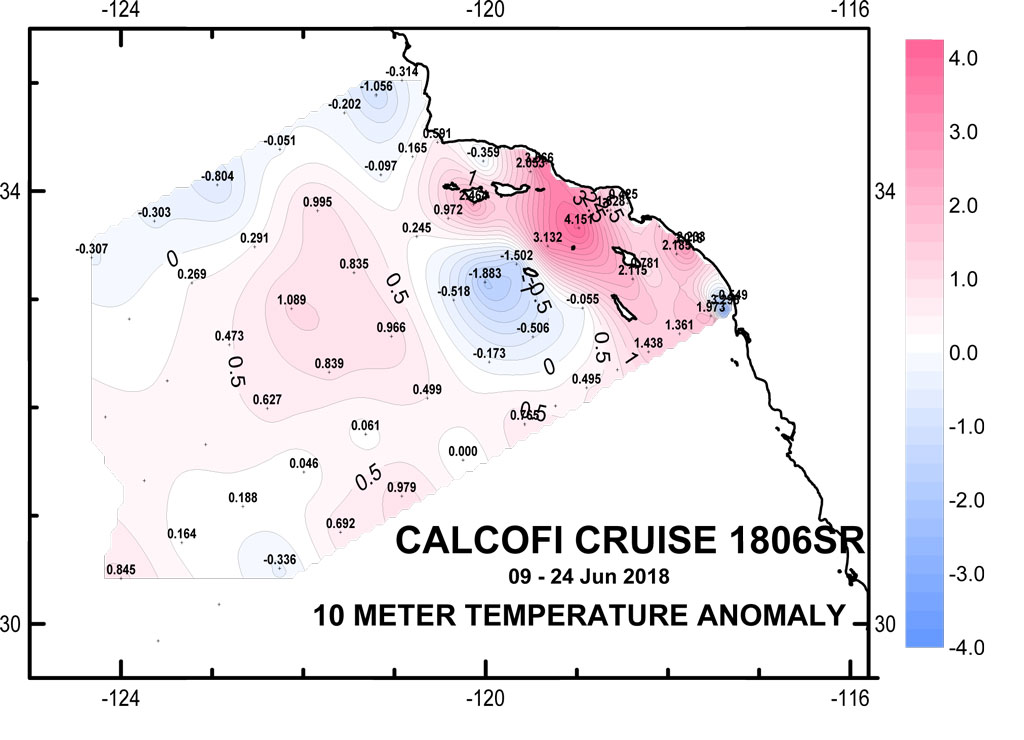
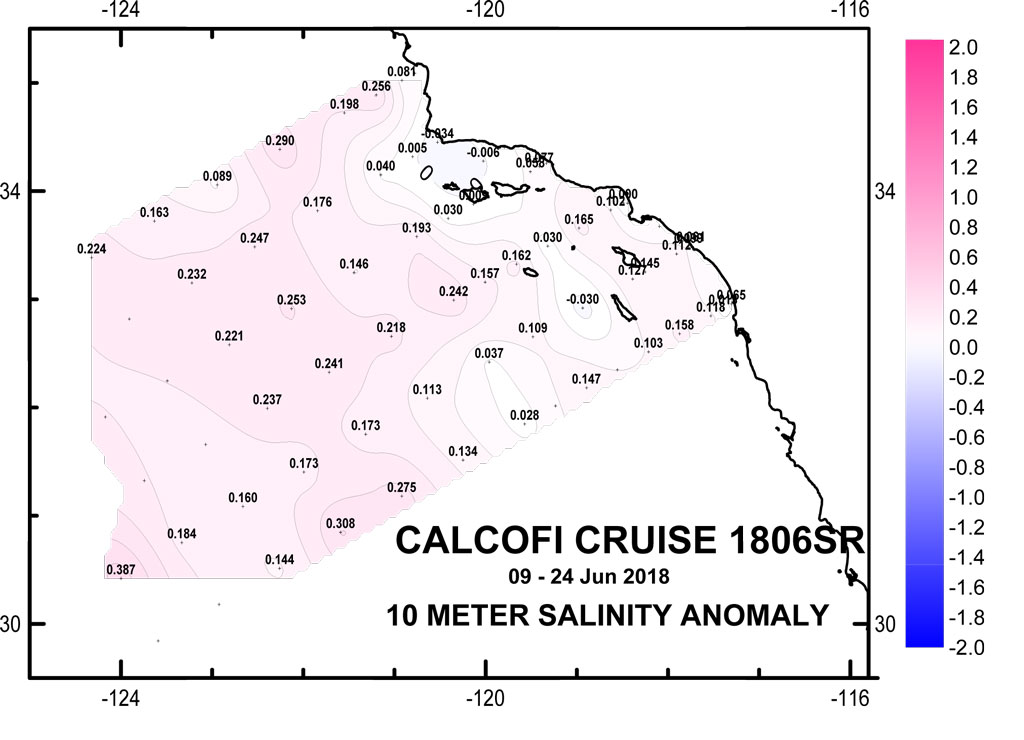
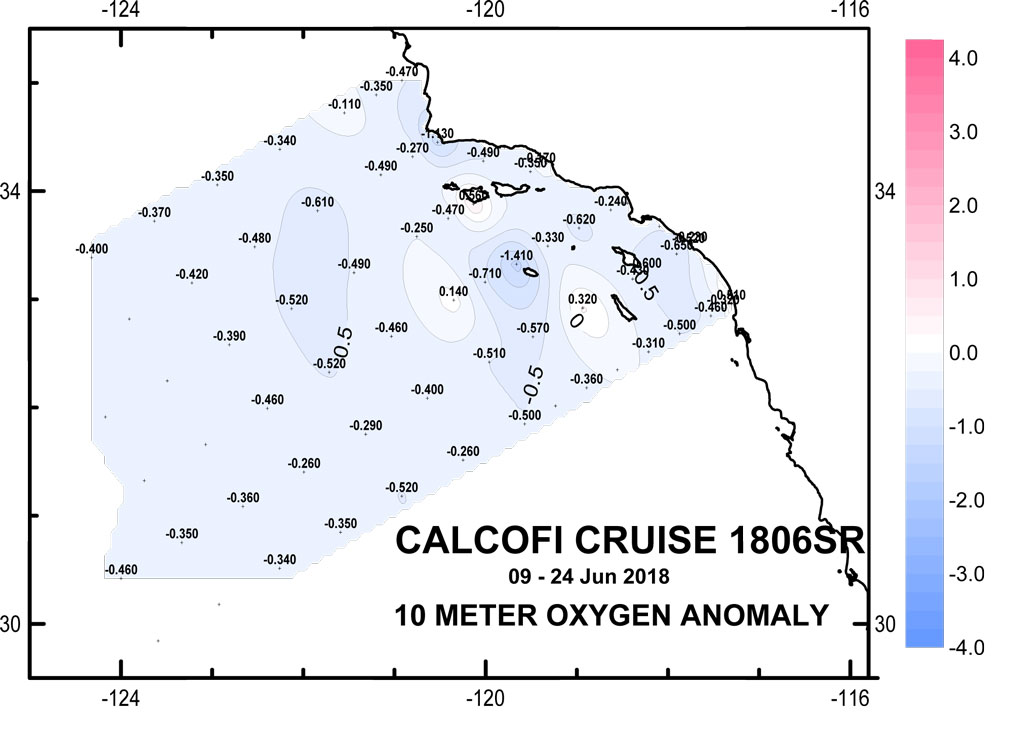
10 meter Anomaly Contours (50 yr mean)
(Click for larger image)
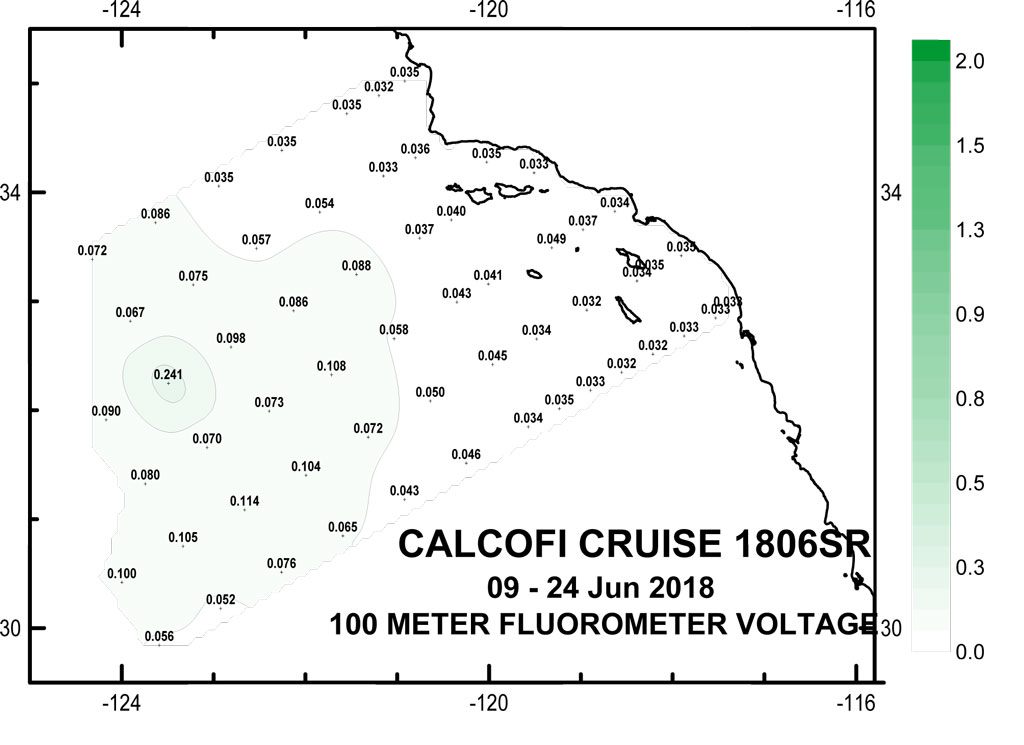
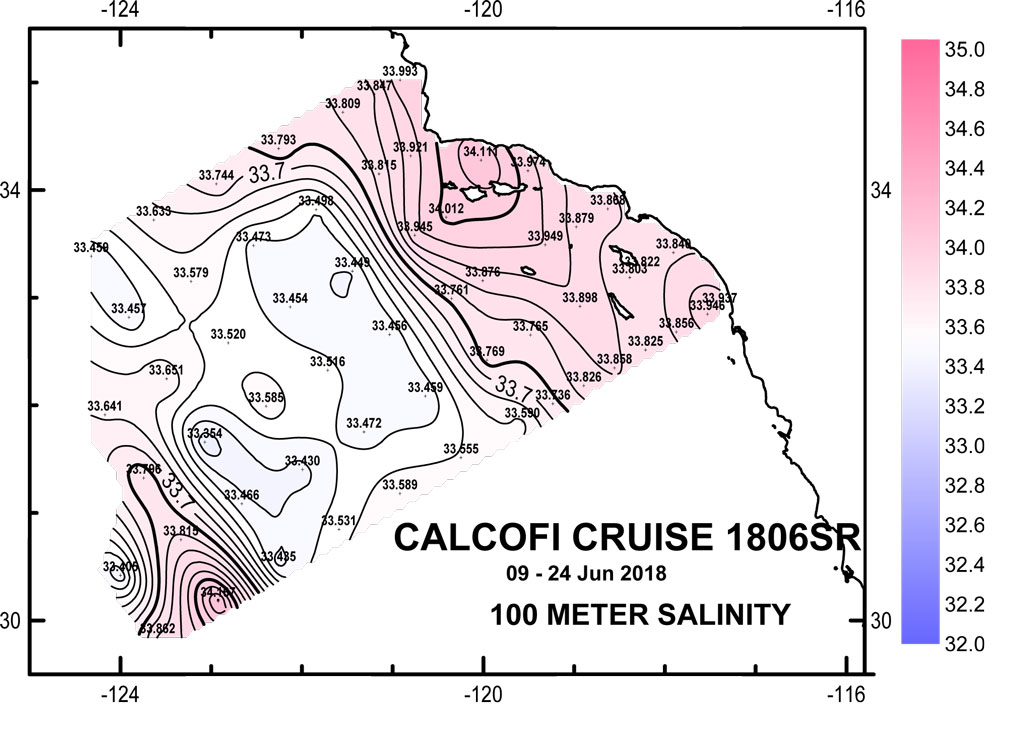
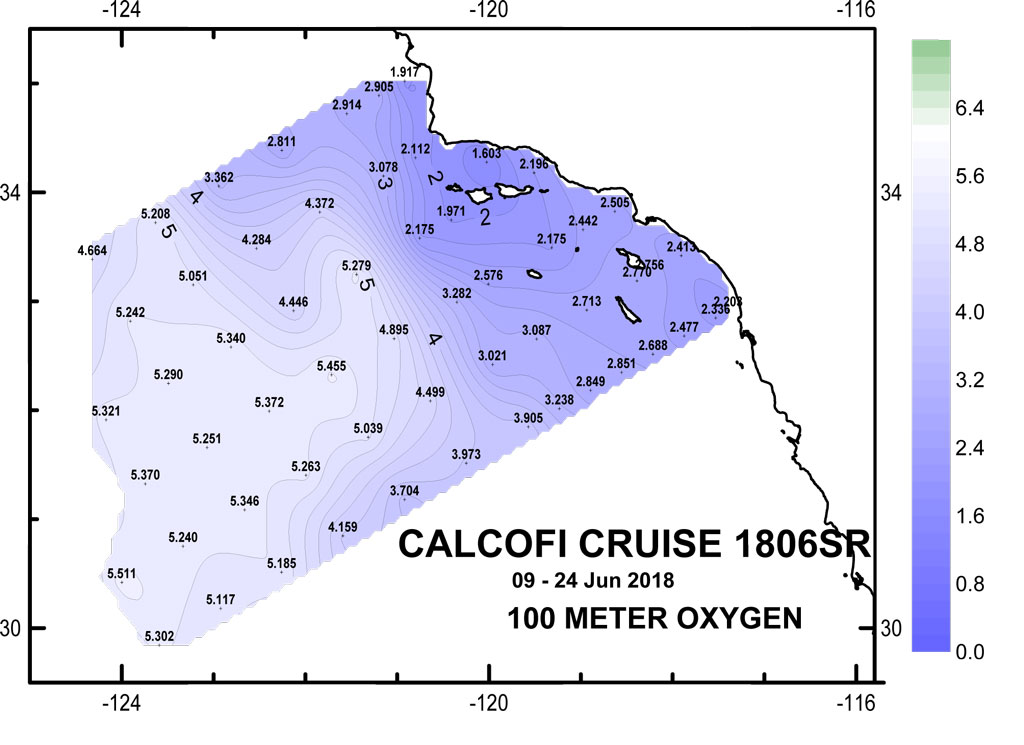
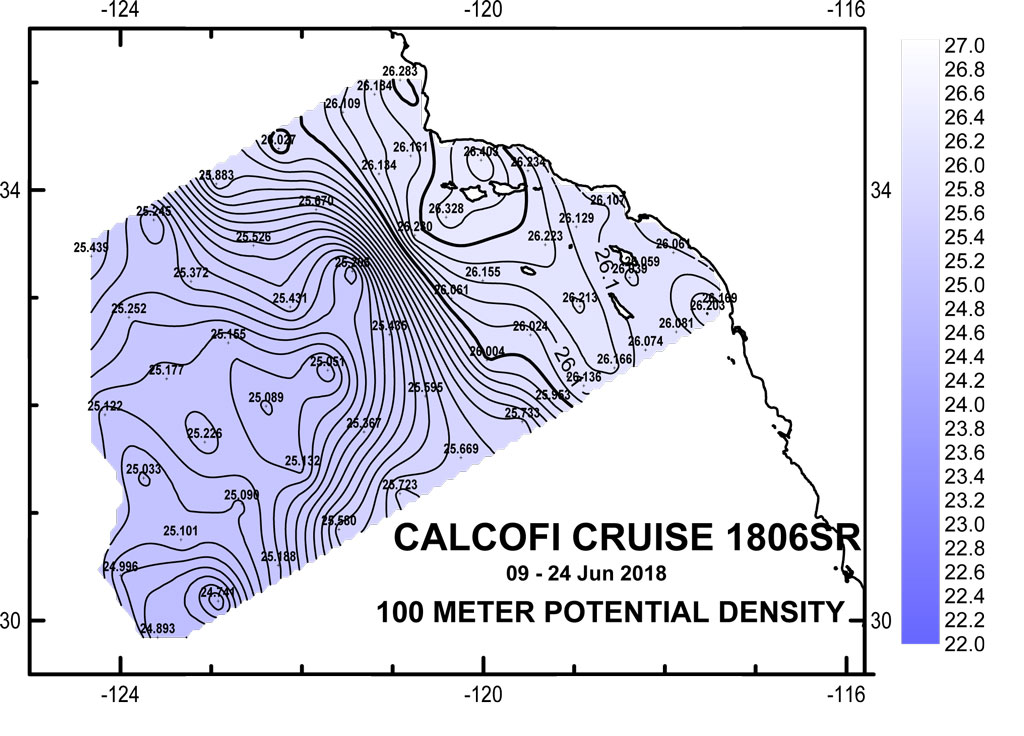
100 meter Preliminary CTD Data Contours
(Click for larger image)
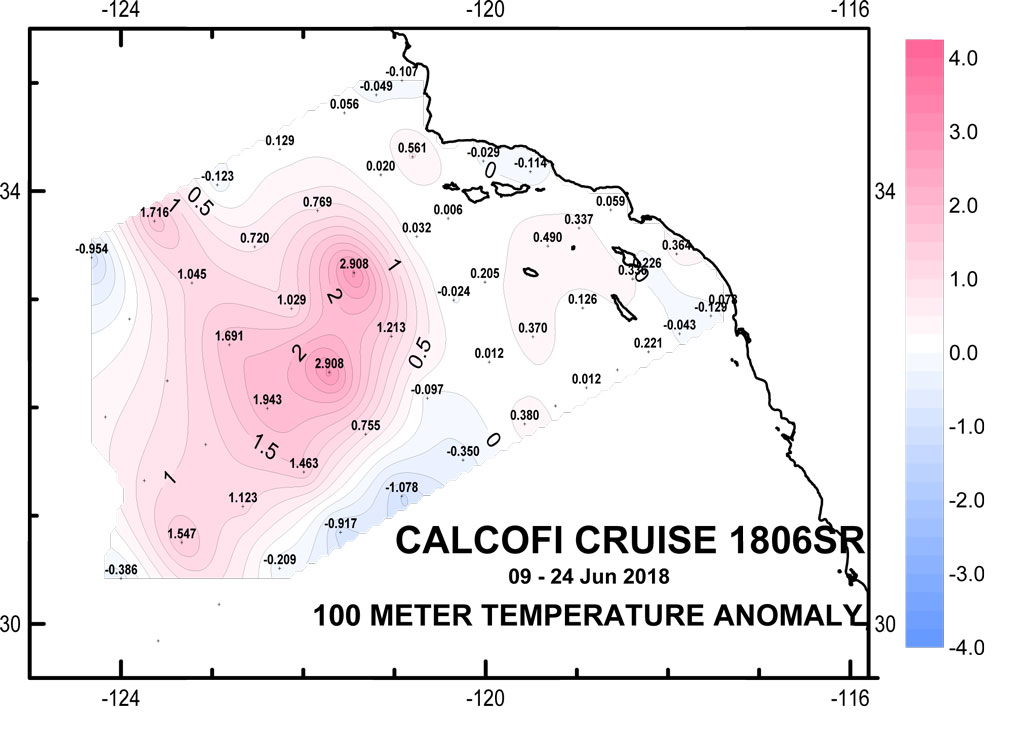
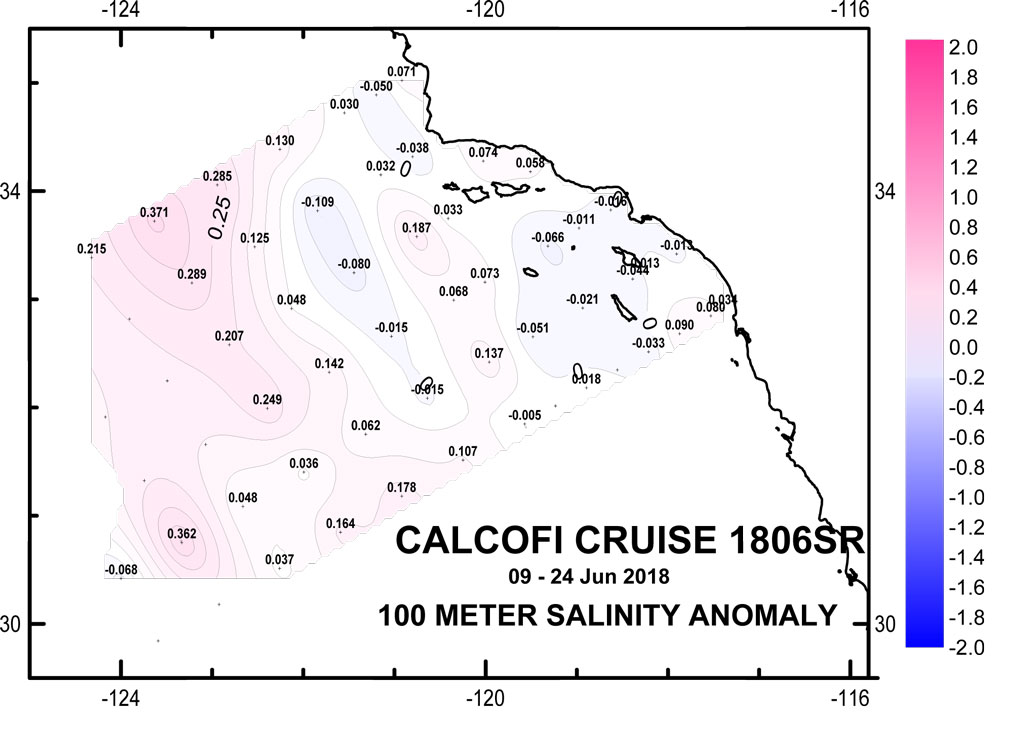
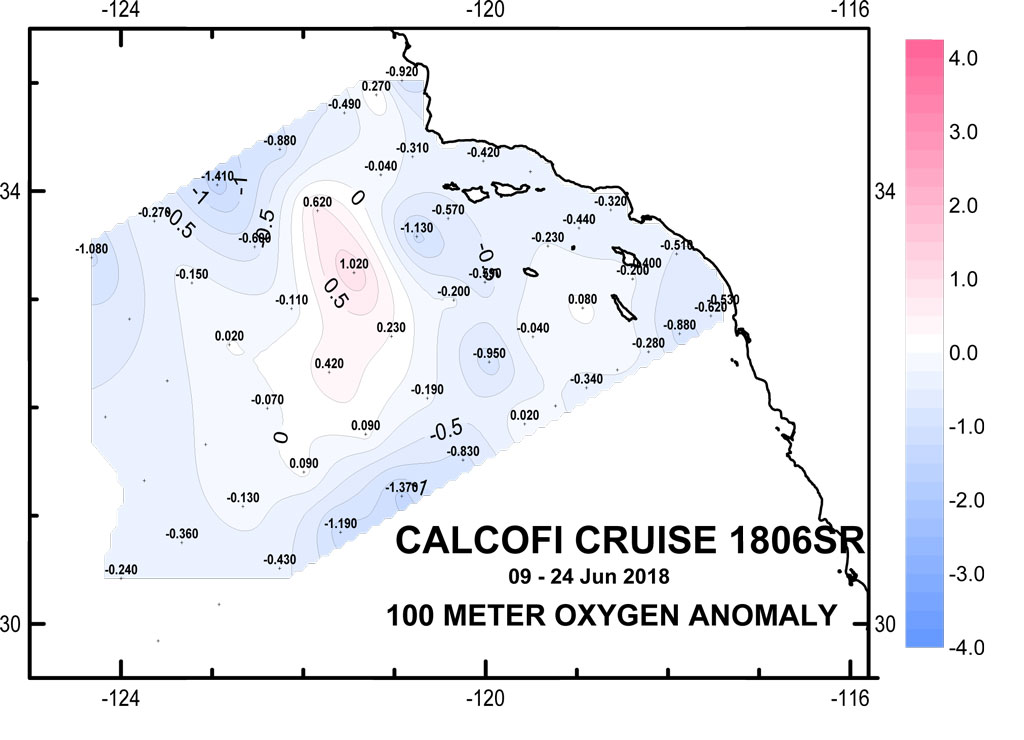
100 meter Anomaly Contours (50 yr mean)
(Click for larger image)
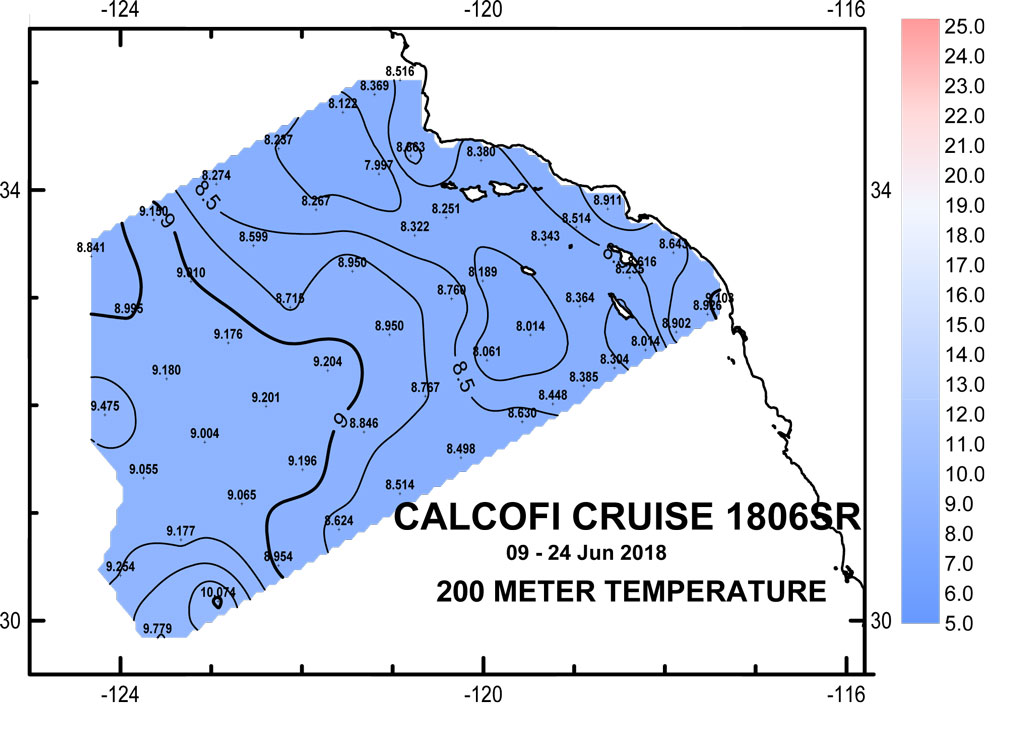
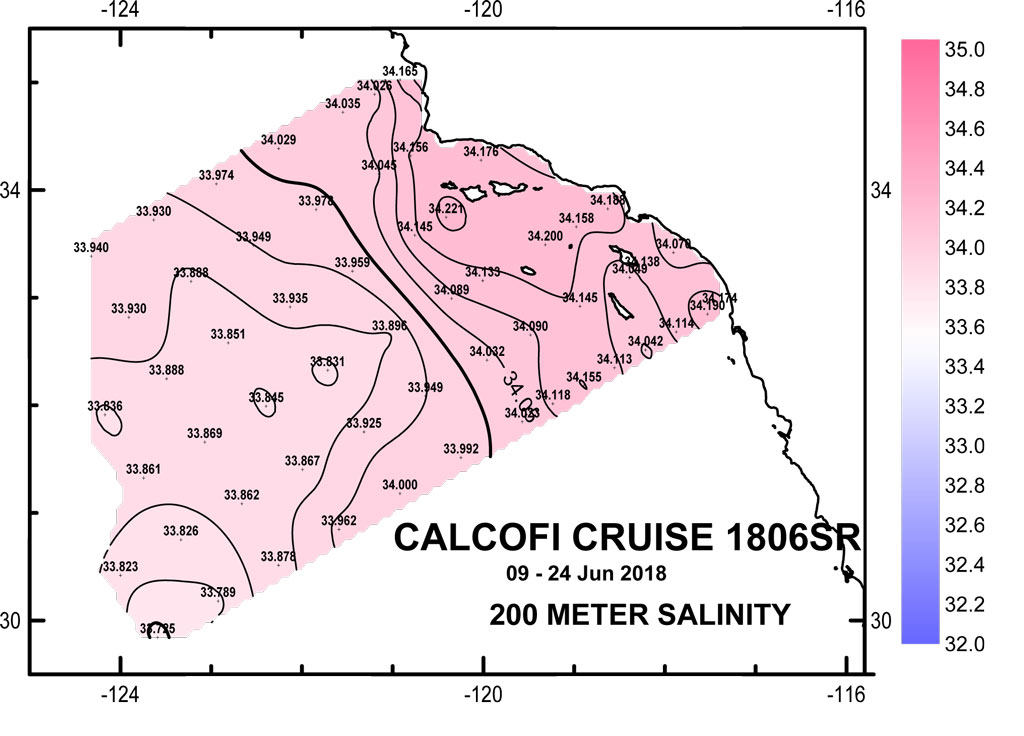
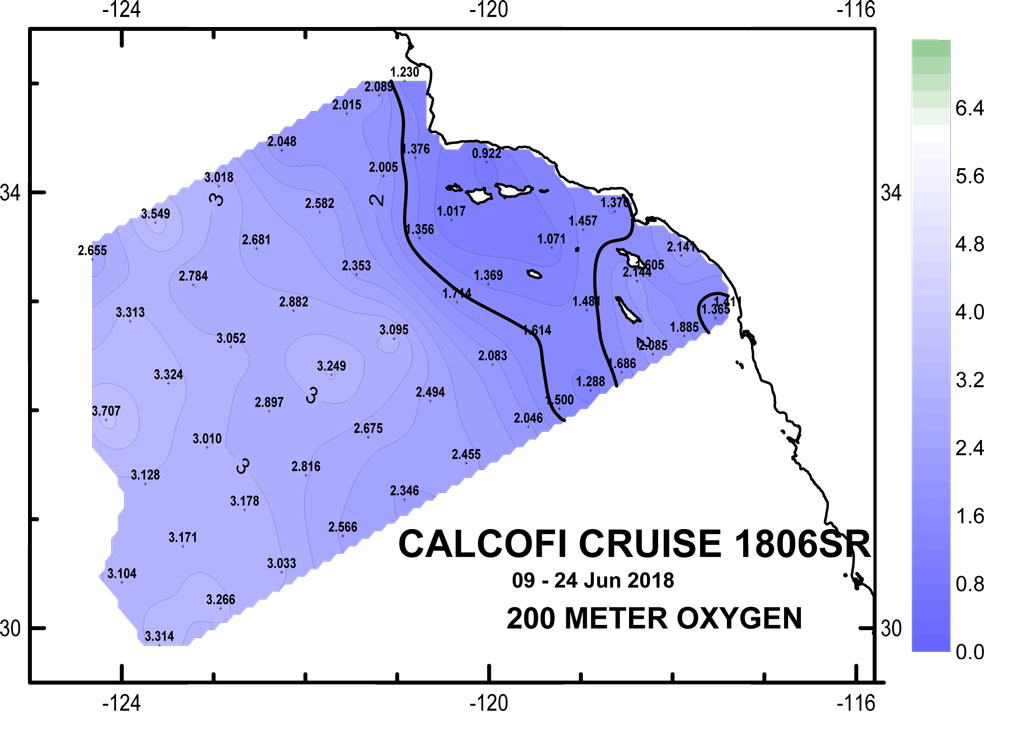
200 meter Preliminary CTD Data Contours
(Click for larger image)
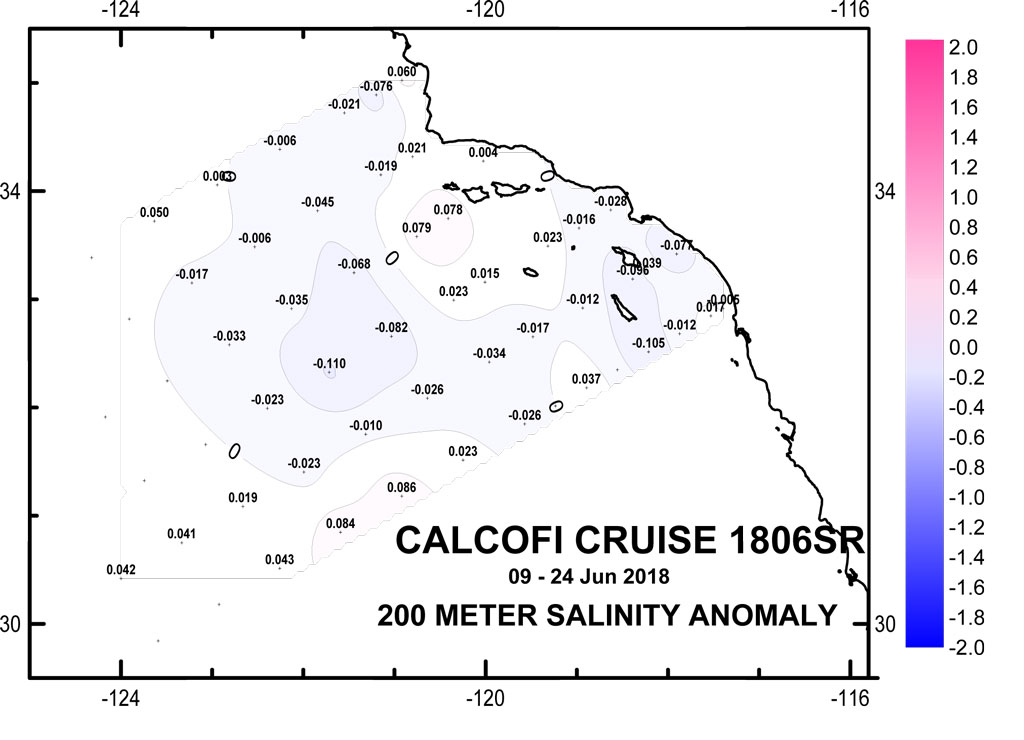
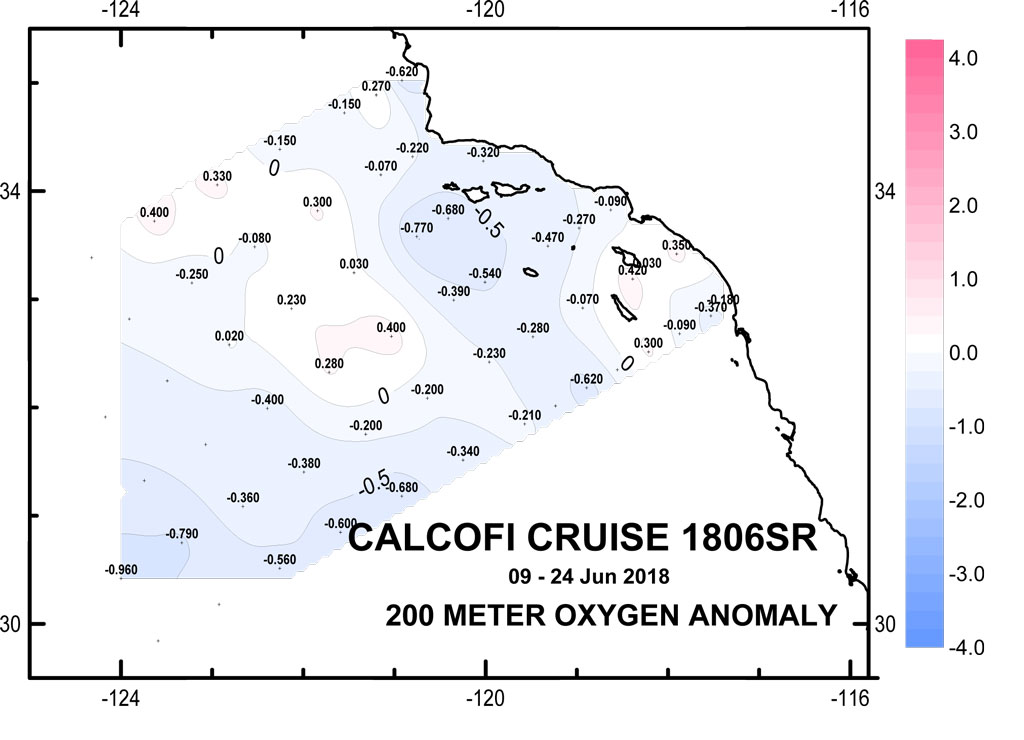
200 meter Anomaly Contours (50 yr mean)
(Click for larger image)
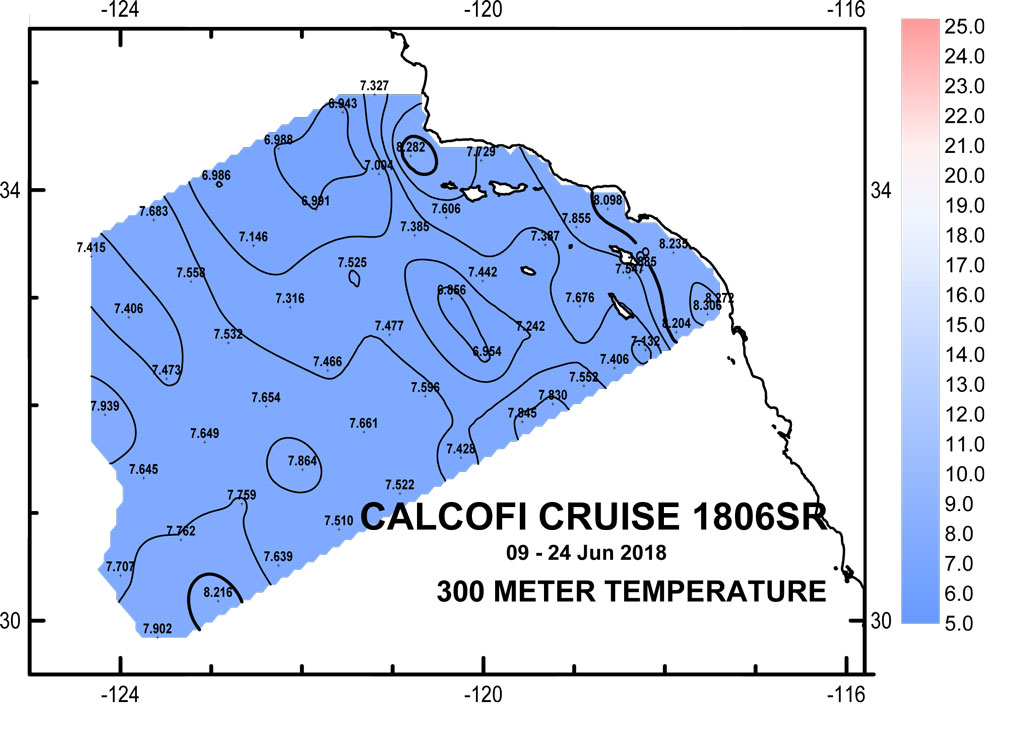
300 meter Preliminary CTD Data Contours
(Click for larger image)
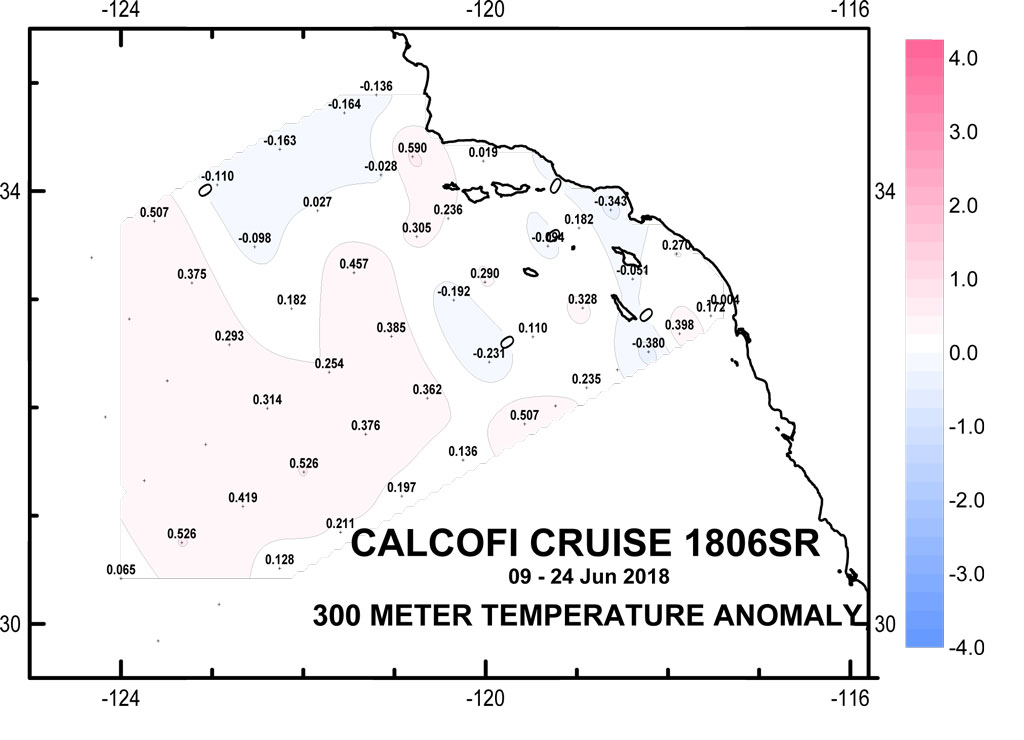
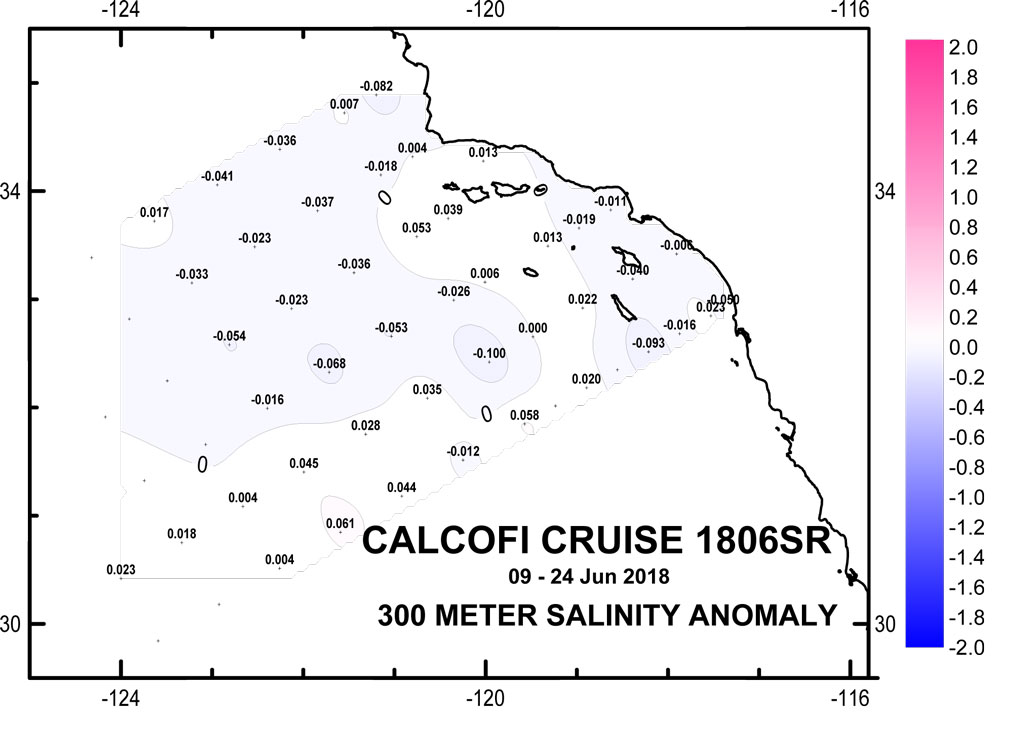
300 meter Anomaly Contours (50 yr mean)
(Click for larger image)
CTD Processing Notes
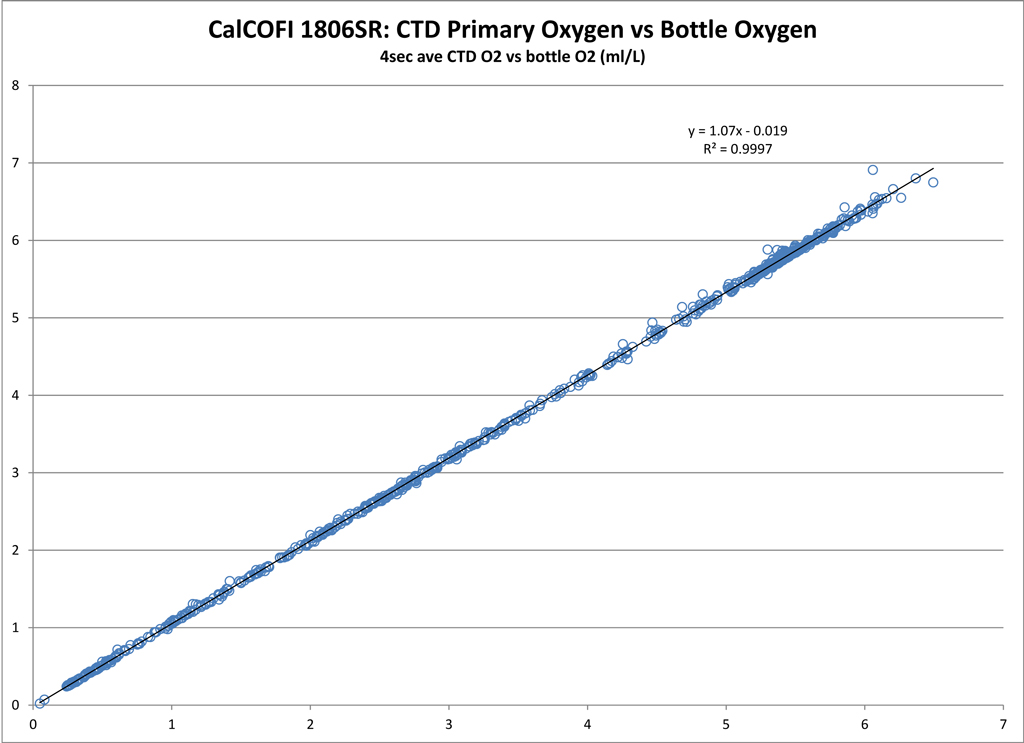
CTD Sensor Corrections:
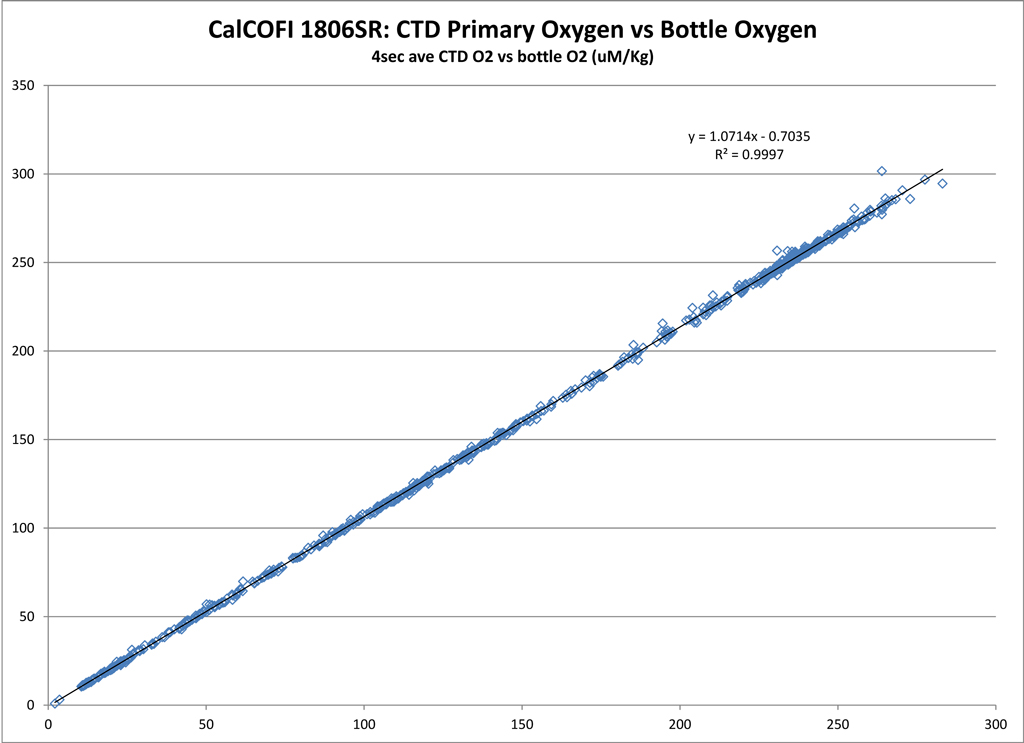
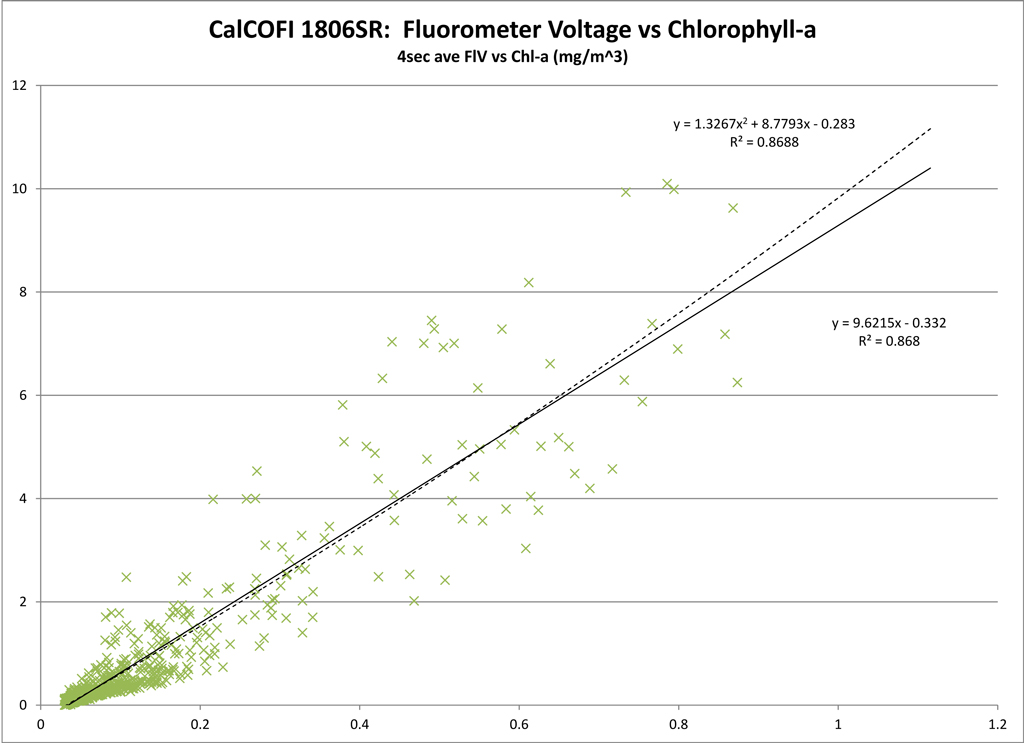
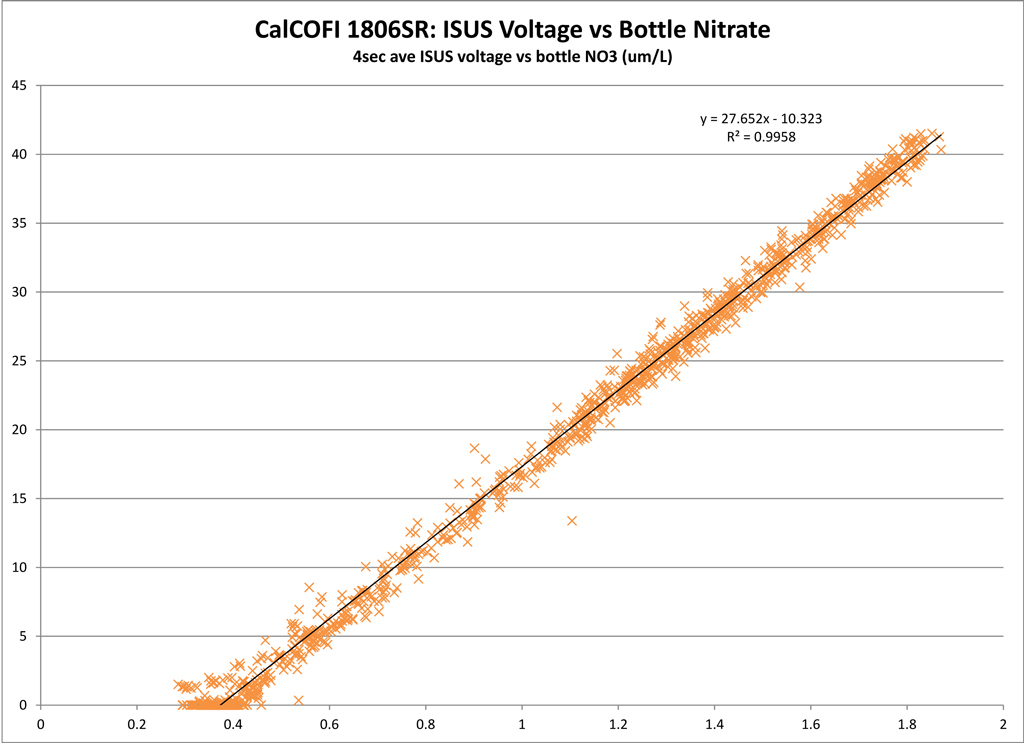
Derived by comparing sensor data (4 sec avg prior-to-bottle closure) to bottle samples.
Dual Salinity (Seabird SBE4) and Oxygen (Seabird SBE43) Sensors
PRIMARY SENSOR
SECONDARY SENSOR
Salinity offset (bottle - sensor; > 350 m)
-0.0045
-0.0071
Oxygen ml/L
y = 1.07x - 0.019; R² = 0.9997
y = 1.0306x + 0.0326; R² = 0.9996
Oxygen umol/Kg
y = 1.0714x - 0.7035; R² = 0.9997
y = 1.032x + 1.543; R² = 0.9996
Single Nitrate (Satlantic ISUS v3 SN111) and Fluorescence (Wetlabs ECO AFL/FL) Sensors
LINEAR
POLYNOMIAL
Nitrate
y = 27.652x - 10.323; R² = 0.9958
Fluorescence
y = 9.6215x - 0.332; R² = 0.868
y = 1.3267x2 + 8.7793x - 0.283; R² = 0.8688
Regressions:
Please note: these regressions are generated from preliminary CTD vs bottle data and will be reprocessed once final bottle data are available. CTD temperatures and salinities do not usually change but oxygen, chlorophyll-a, and nitrate may change significantly after QAQC. Questionable or mistrip bottle data are removed from these comparisons but may be visible on the CTD.csv plots. For this cruise and future cruises, both primary & secondary sensor profiles vs bottle data will be generated and archived in the downloadable CTD+Bottle data files. These plots are under the “csv-plots\Primary” & “csv-plots\Secondary” subdirectories.