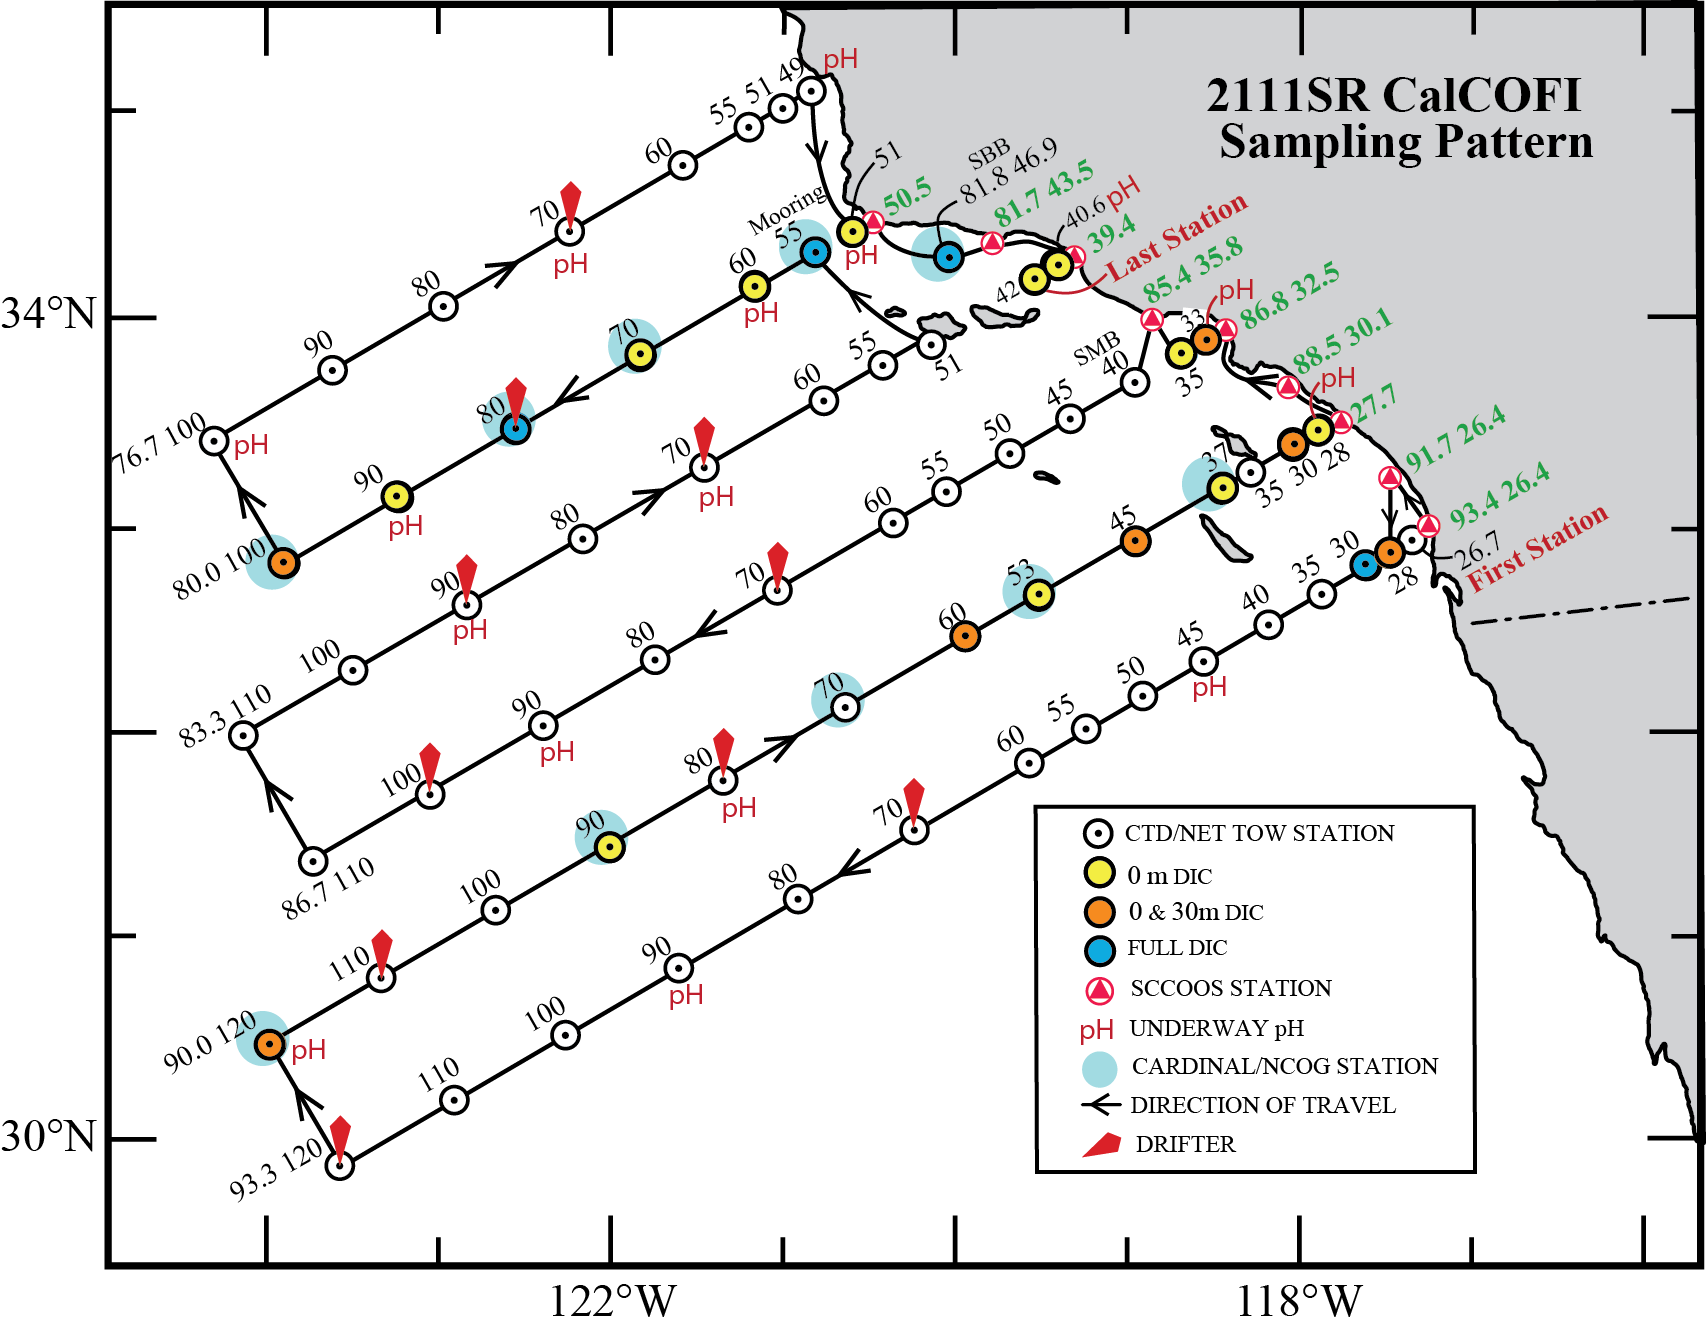
CalCOFI 2111SR sailed on SIO Sally Ride on 31 October 2021 at 0600PDT from MarFac, San Diego. 75 of 75 science stations were successfully occupied. CTD casts and various net tows were completed at each science station. The cruise ended at MarFac, San Diego on 15 November 2021 at 0600PDT.
NEW MBARI SAtlantic ISUS was replaced by a newer model. From here on out CalCOFI will be using the SBS Deep SUNA (Submersible Ultraviolet Nitrate Analyzer).
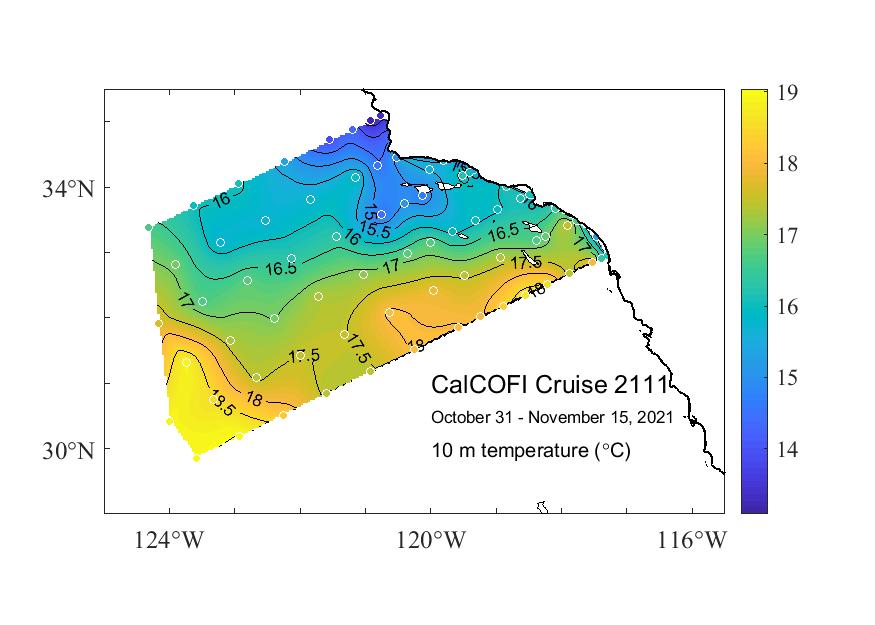
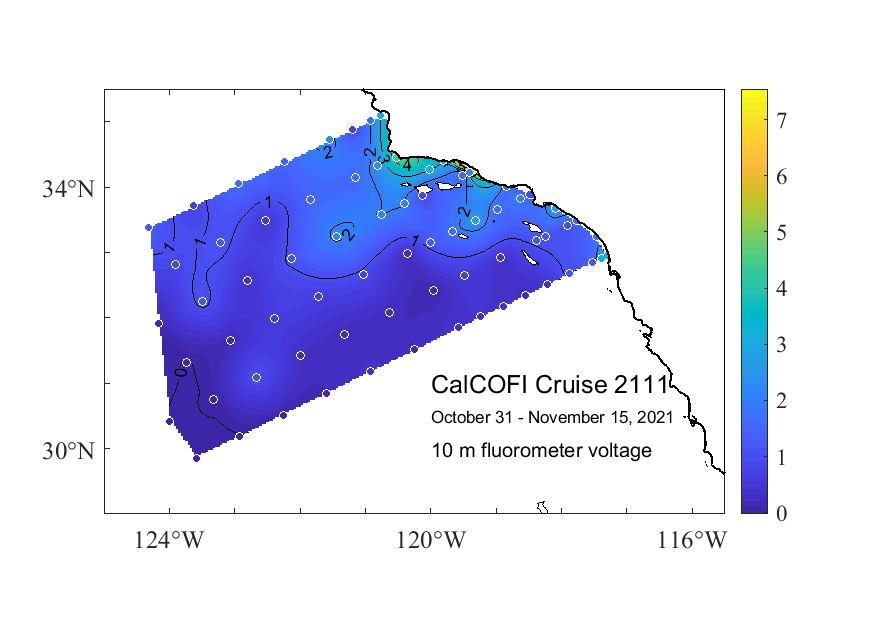
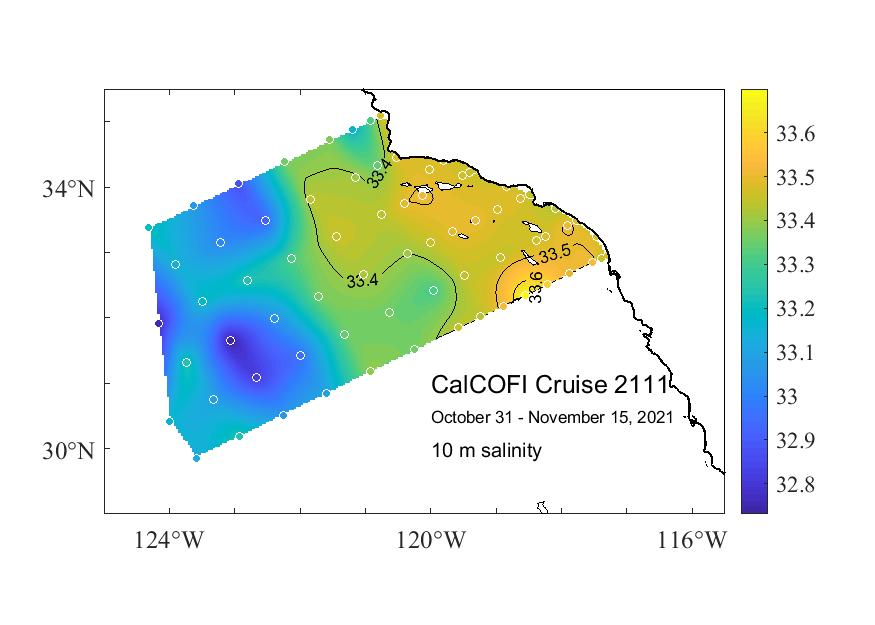
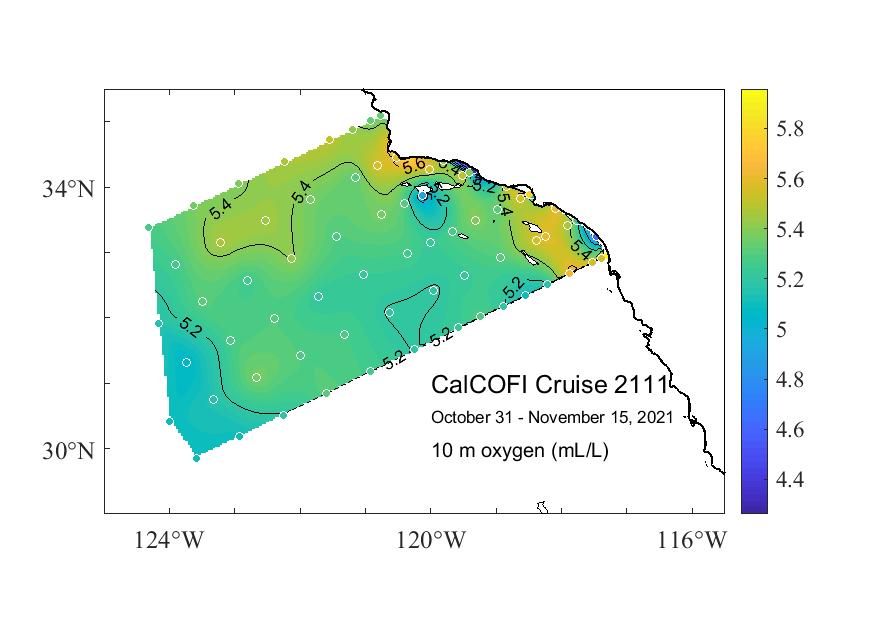
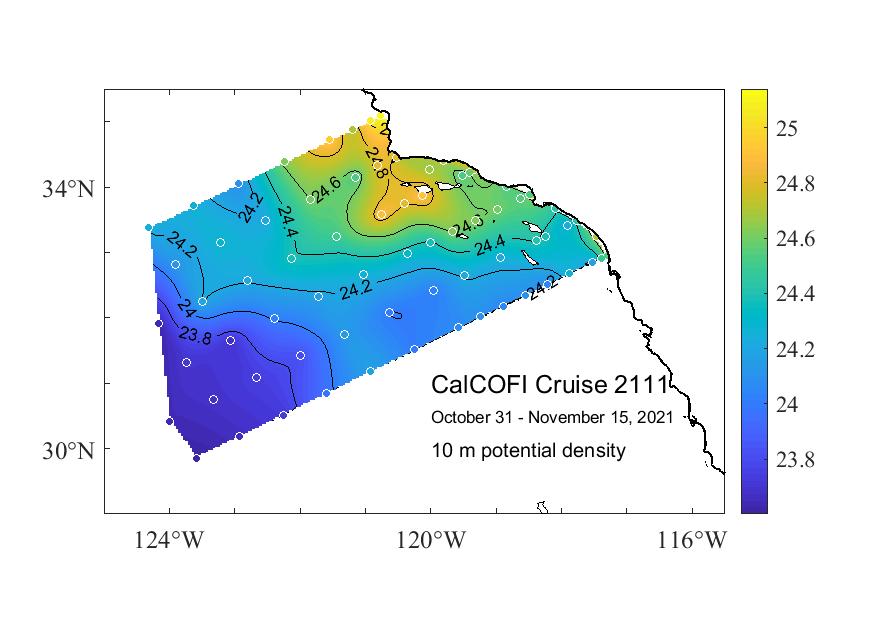
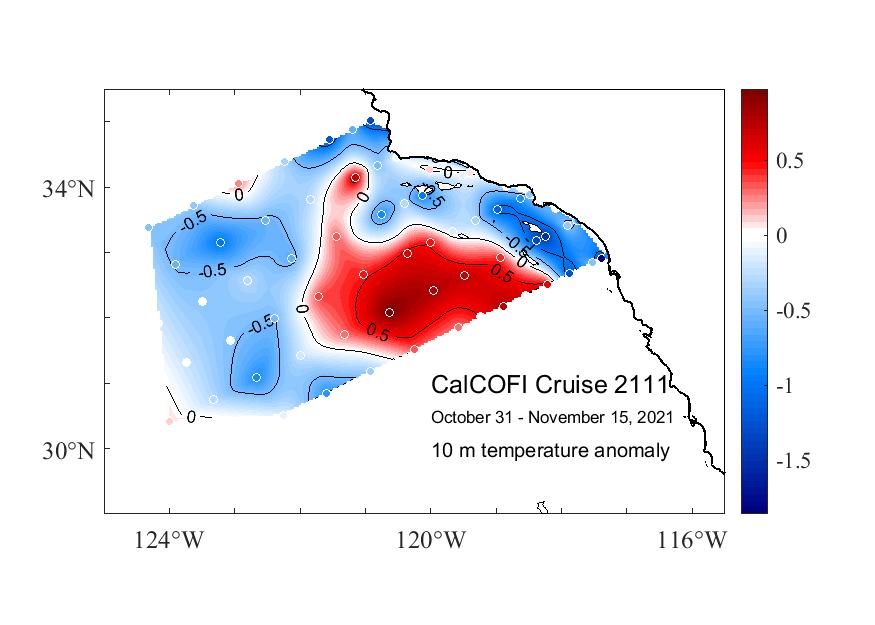
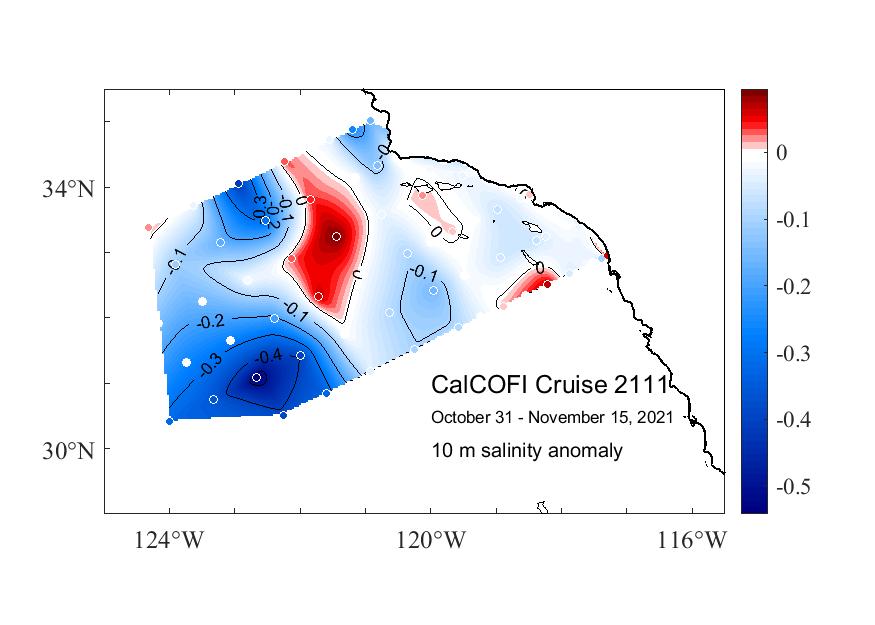
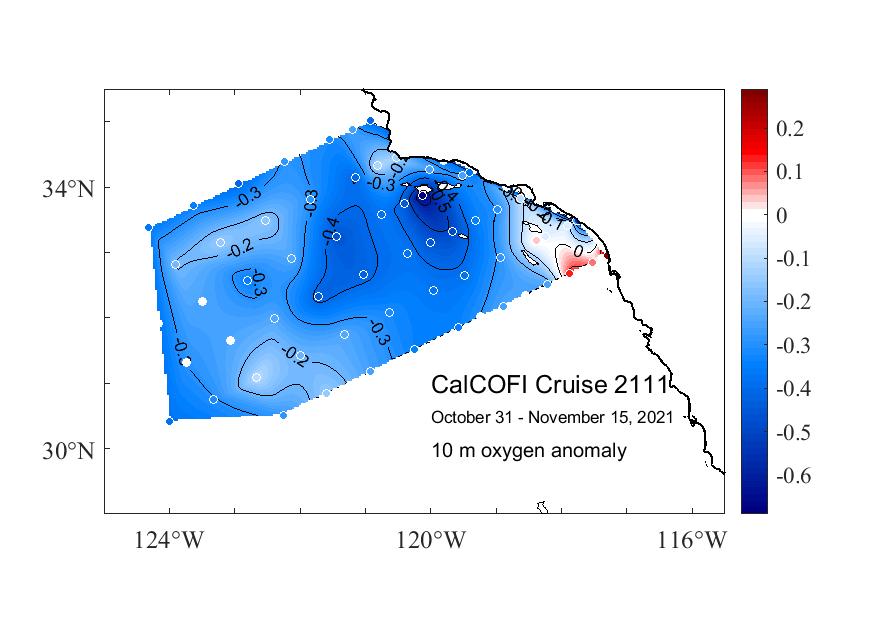
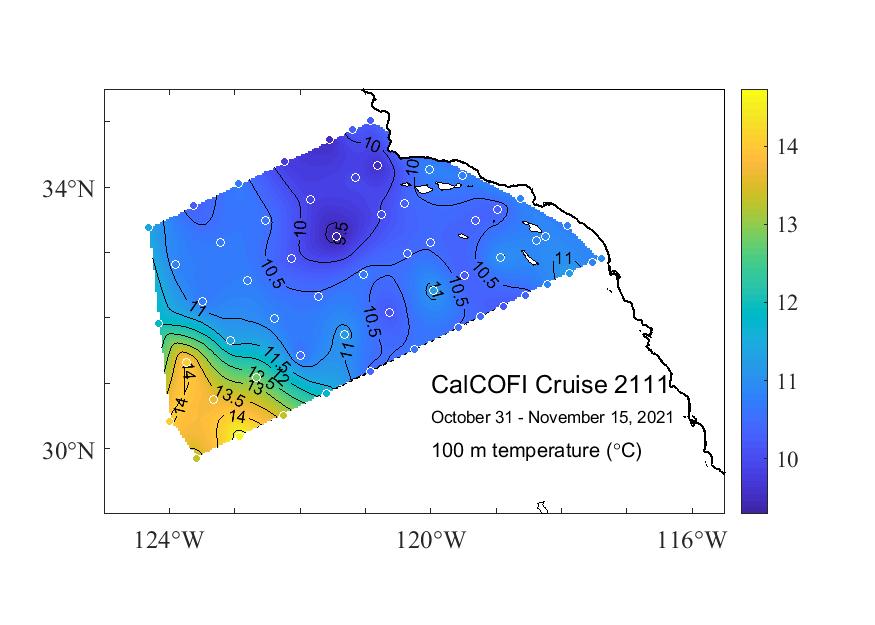
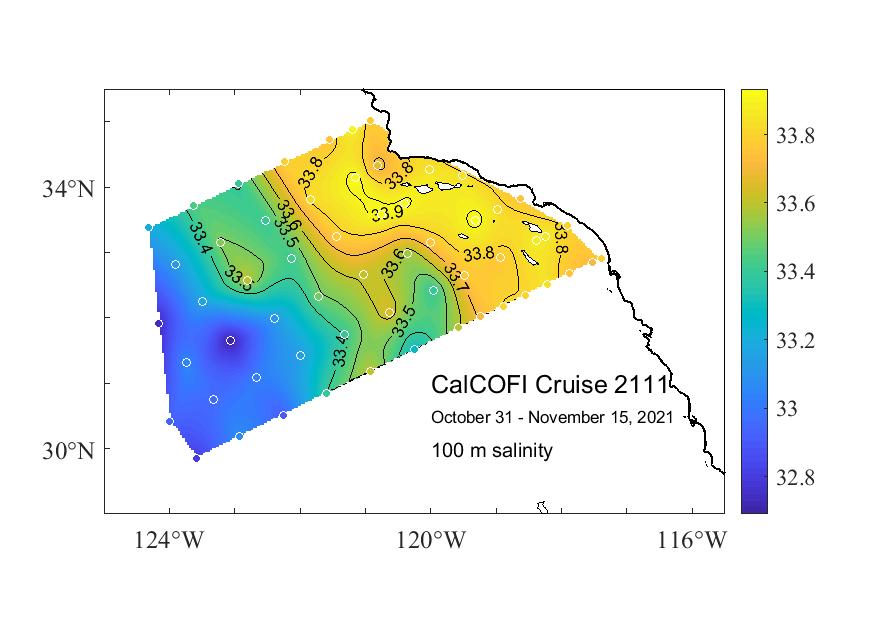
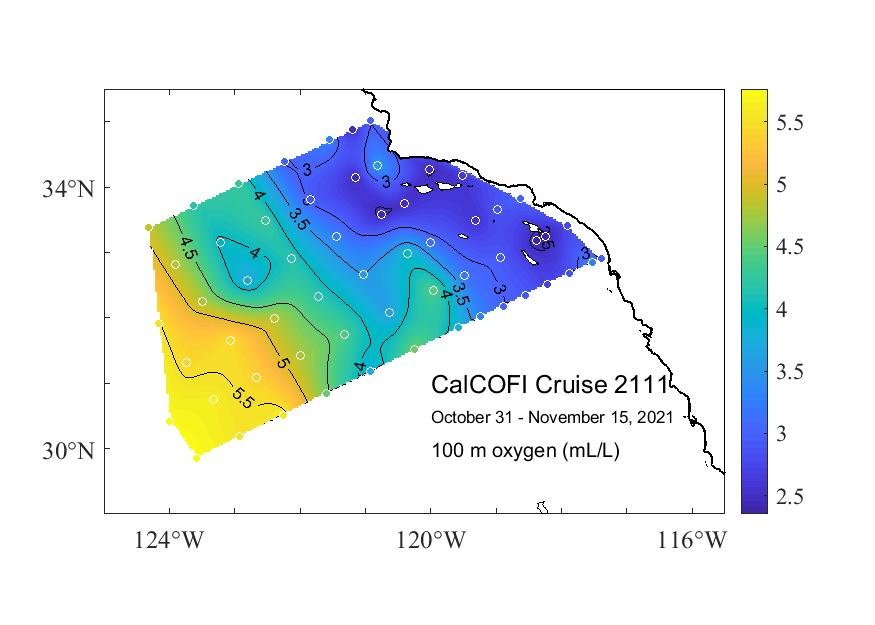
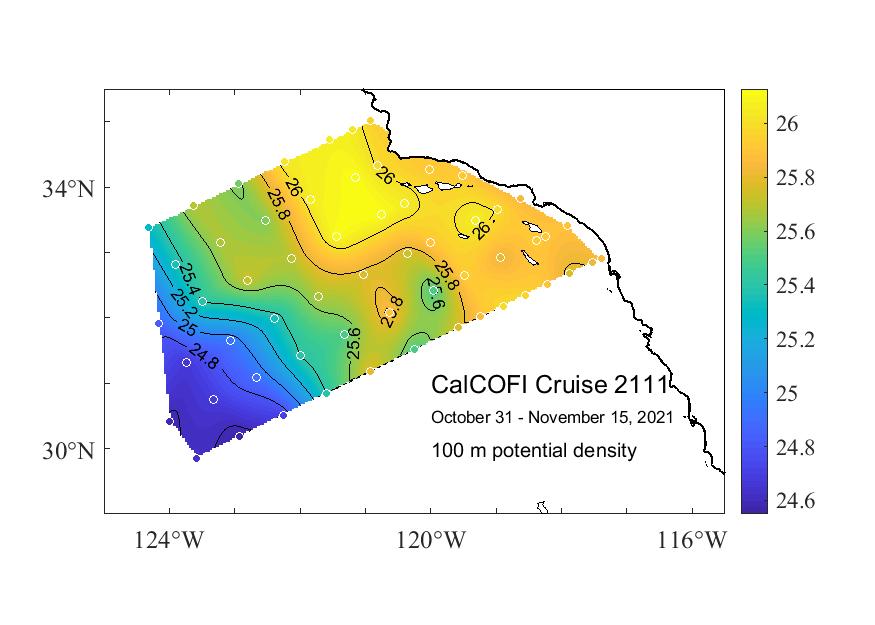
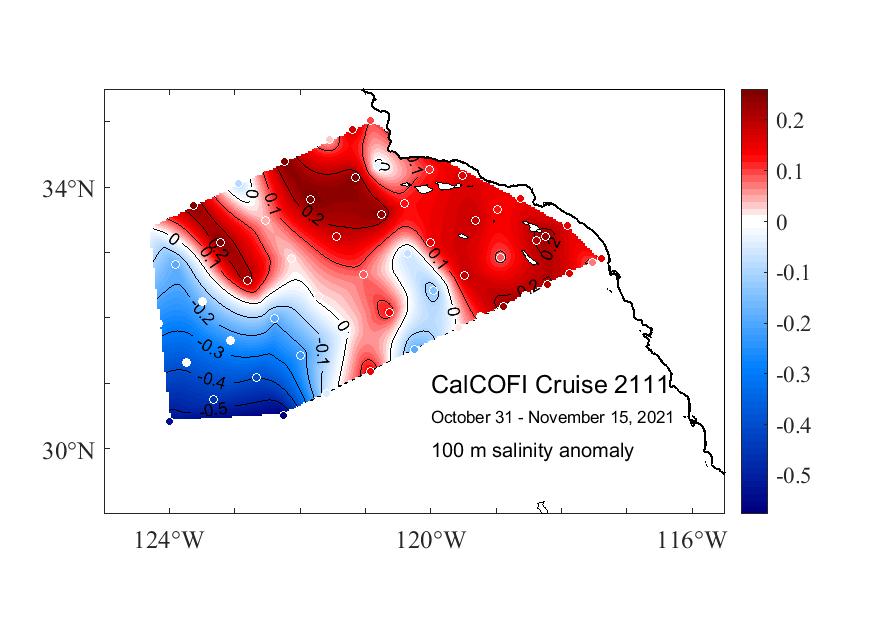
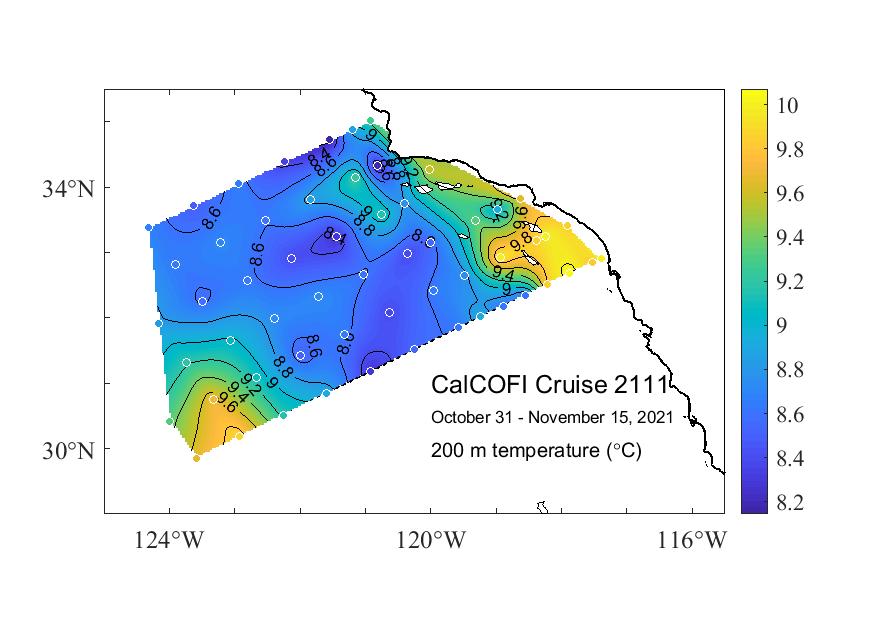
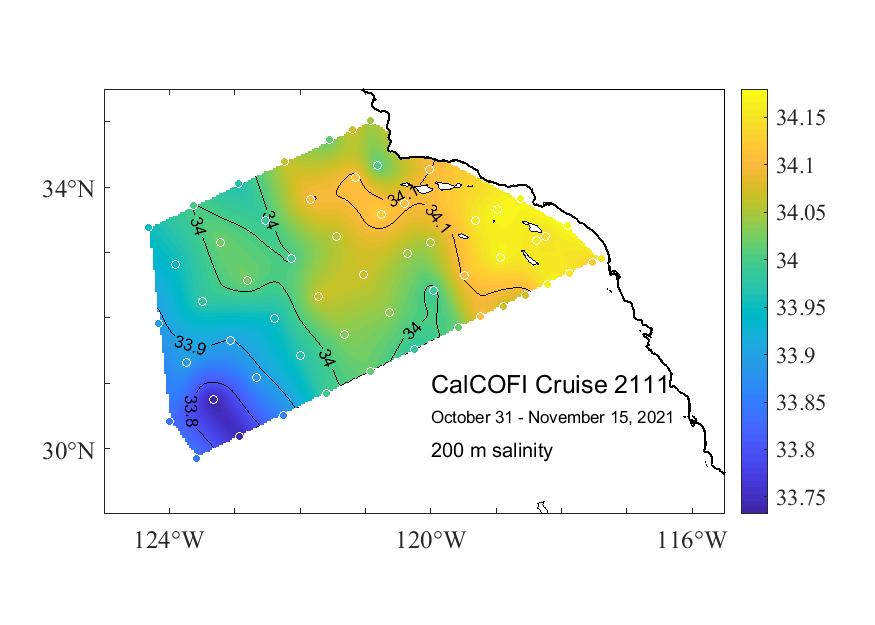
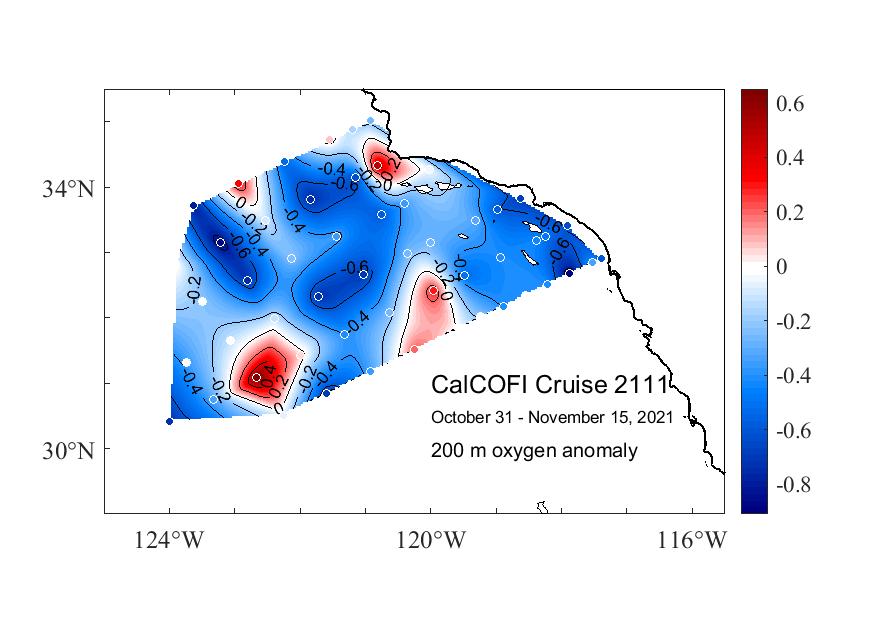
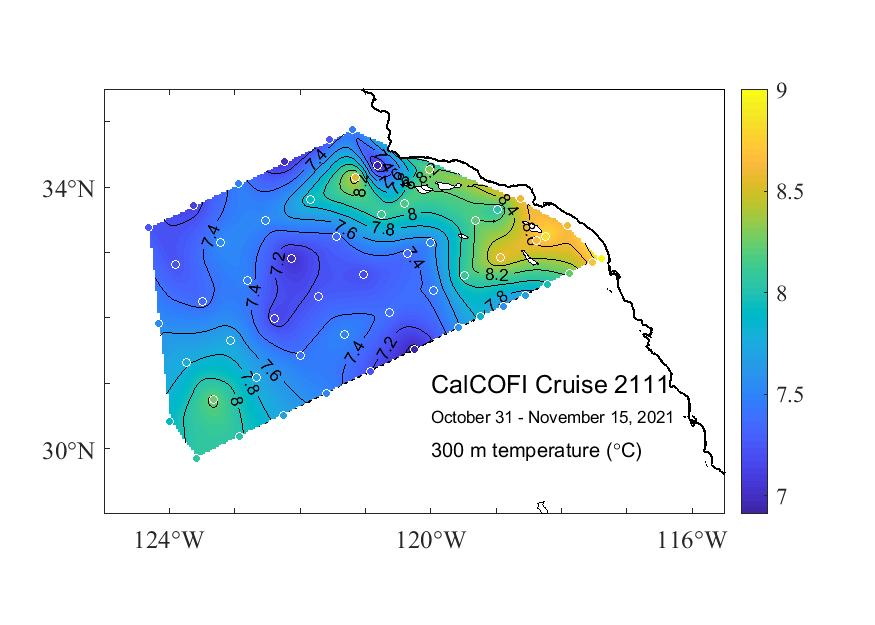
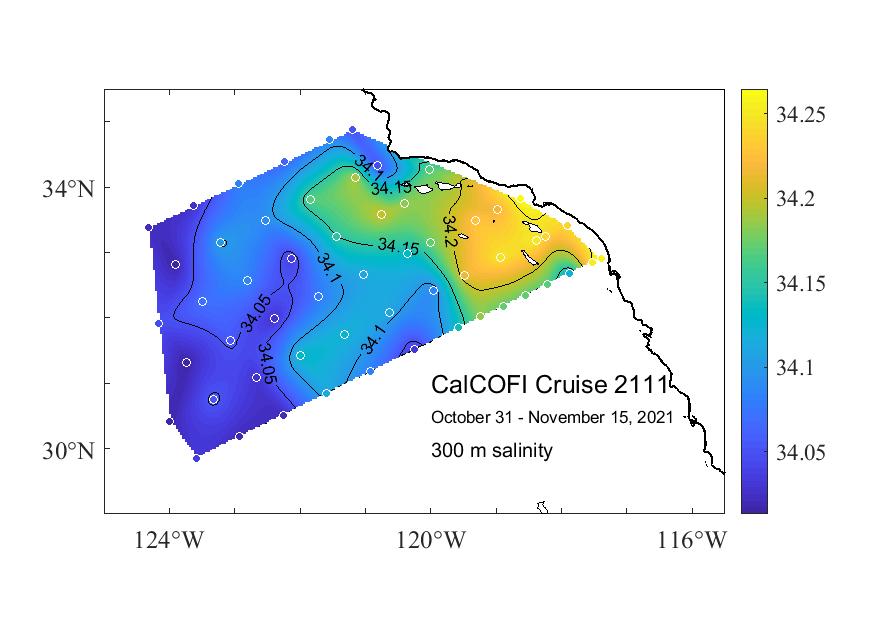
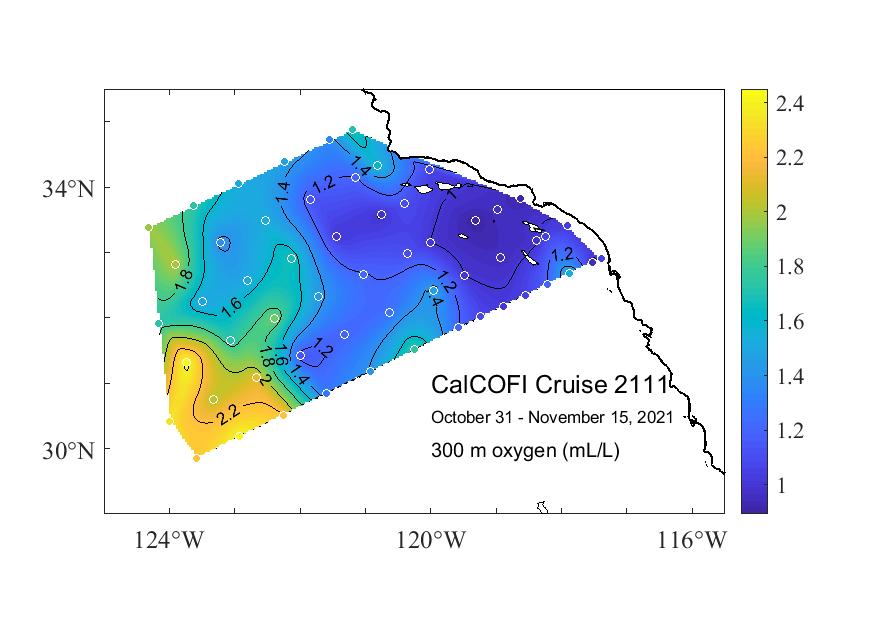
Please note: these data are 1m-bin-average Seasoft-processed CTD data that have not gone through quality control checks or bottle corrections. Anomalies are based on 50-year harmonics (1949-1999).
10 meter Preliminary CTD Data Contours
(Click for larger image)
10 meter Anomaly Contours (50 yr mean)
(Click for larger image)
100 meter Preliminary CTD Data Contours
(Click for larger image)
100 meter Anomaly Contours (50 yr mean)
(Click for larger image)
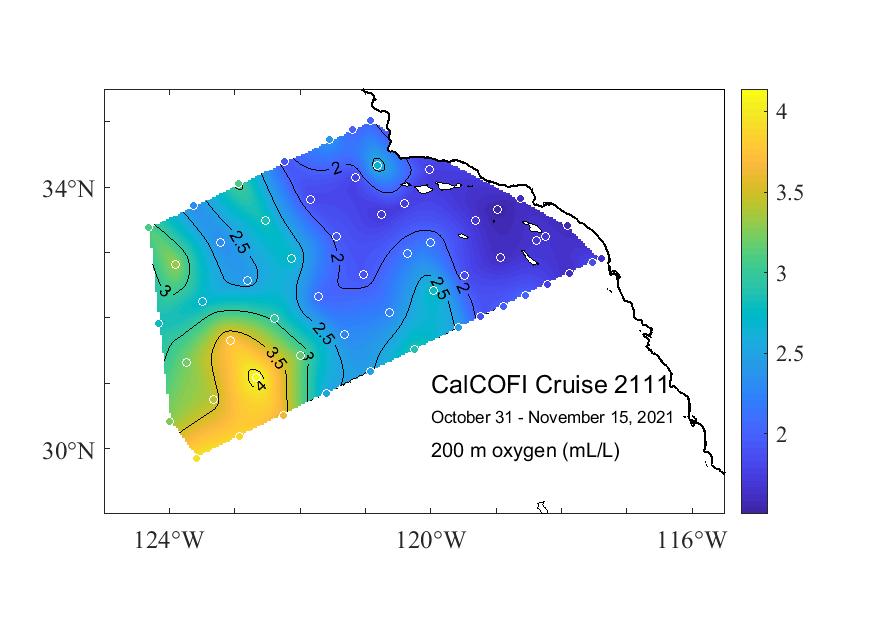
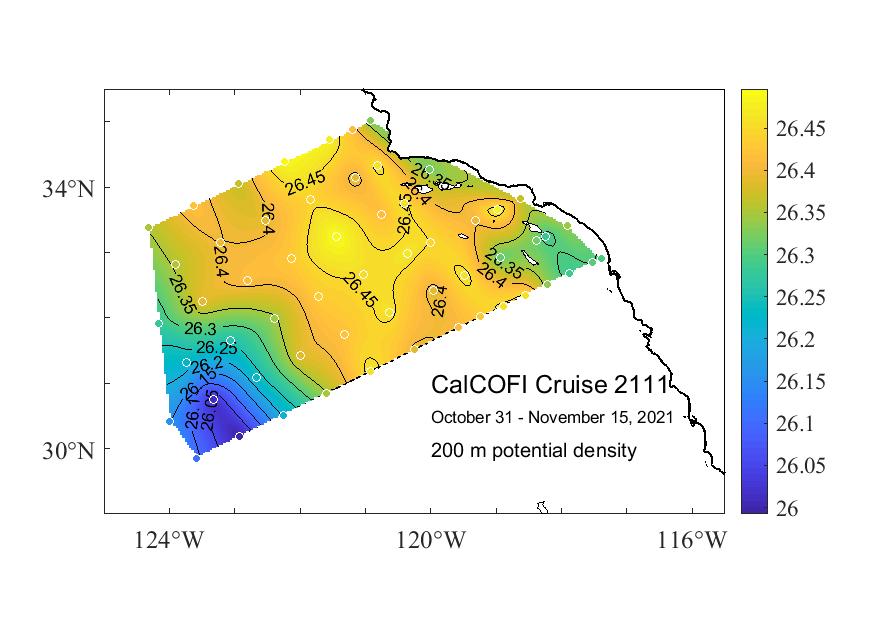
200 meter Preliminary CTD Data Contours
(Click for larger image)
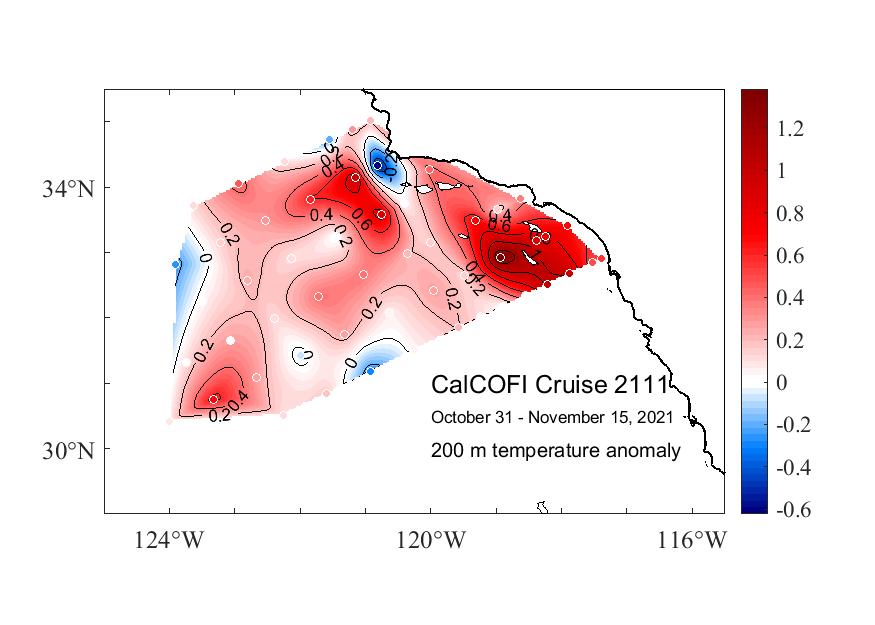
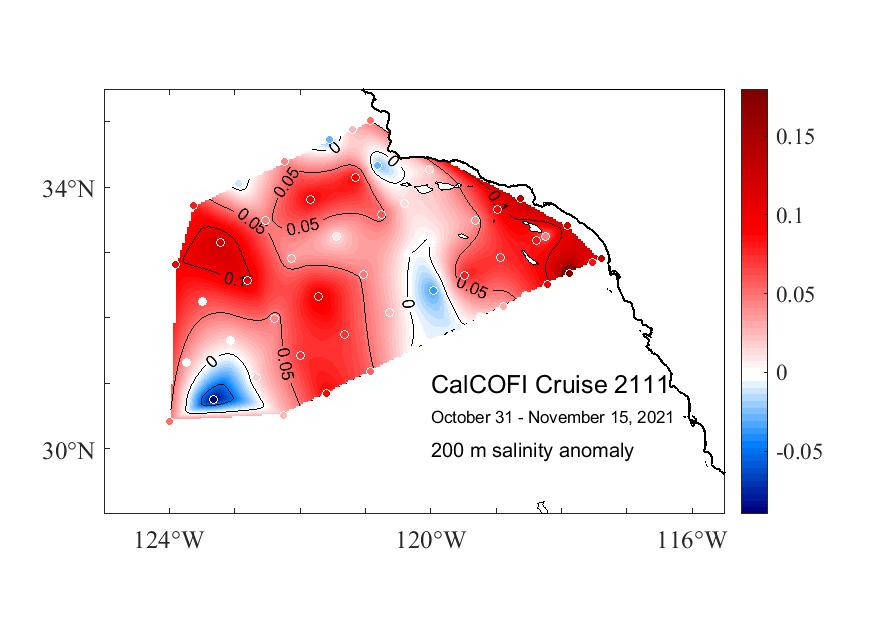
200 meter Anomaly Contours (50 yr mean)
(Click for larger image)
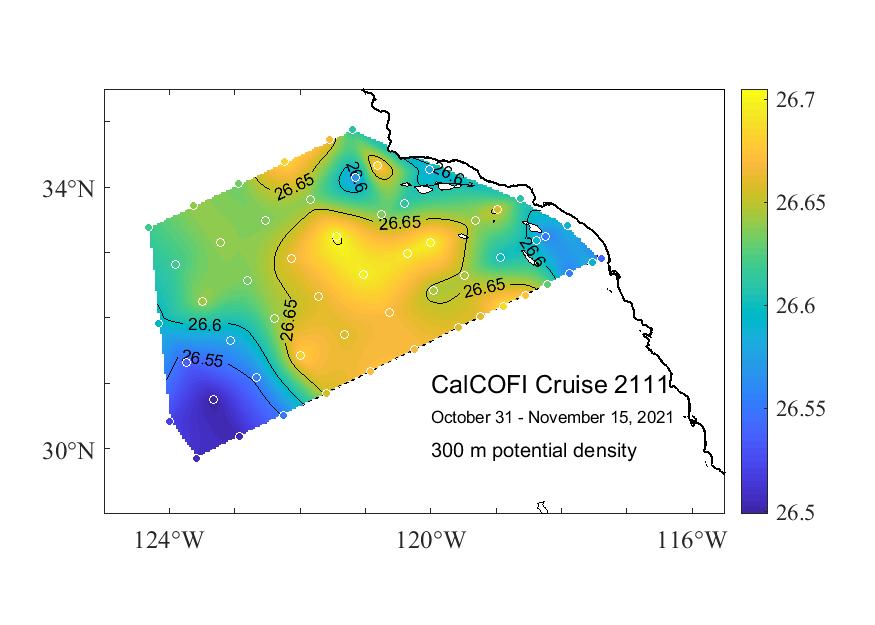
300 meter Preliminary CTD Data Contours
(Click for larger image)
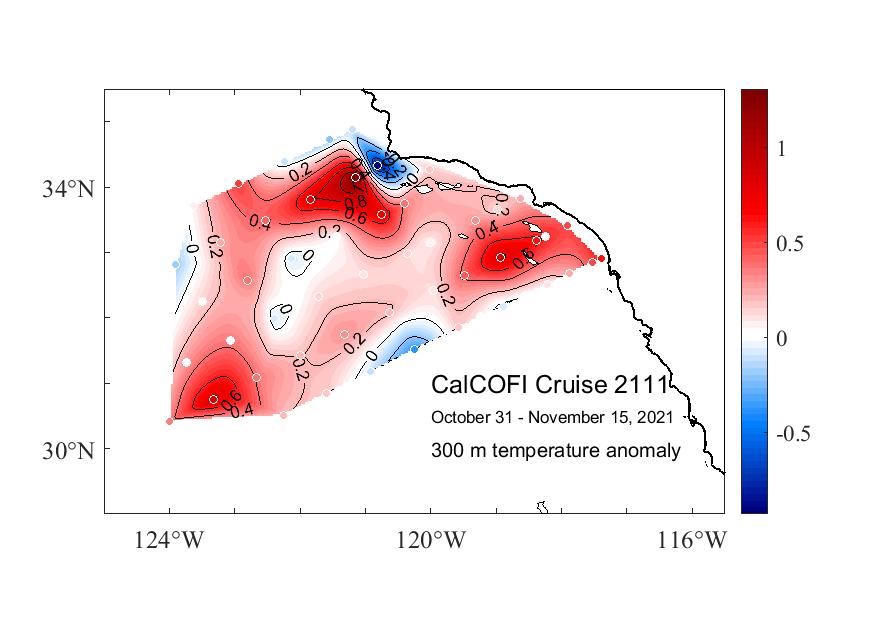
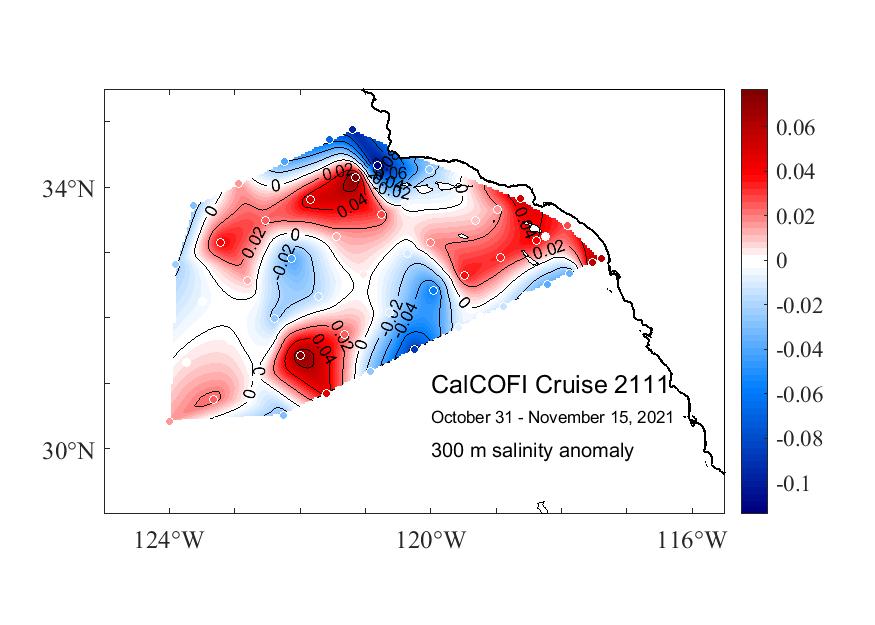
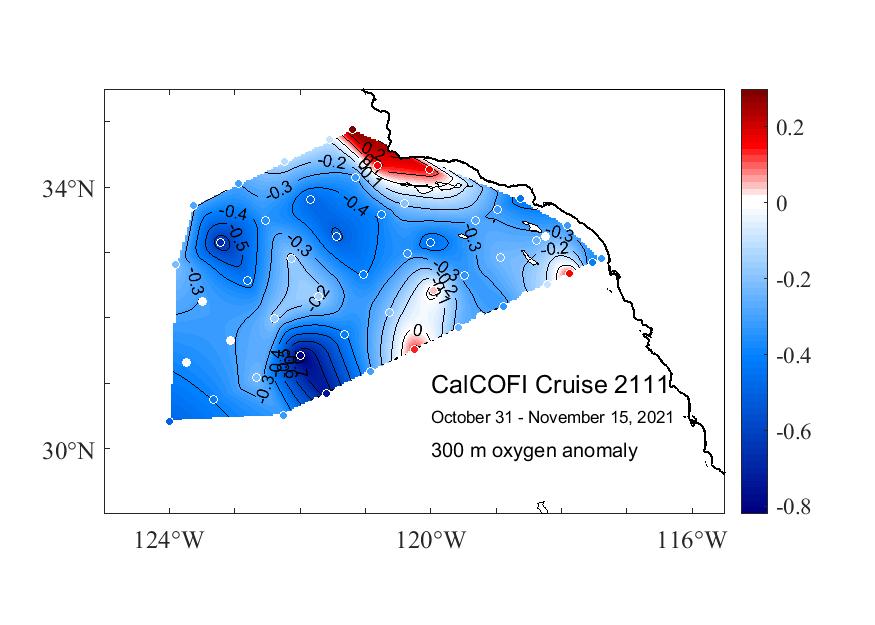
300 meter Anomaly Contours (50 yr mean)
(Click for larger image)
CTD Processing Notes
CTD Sensor Corrections:
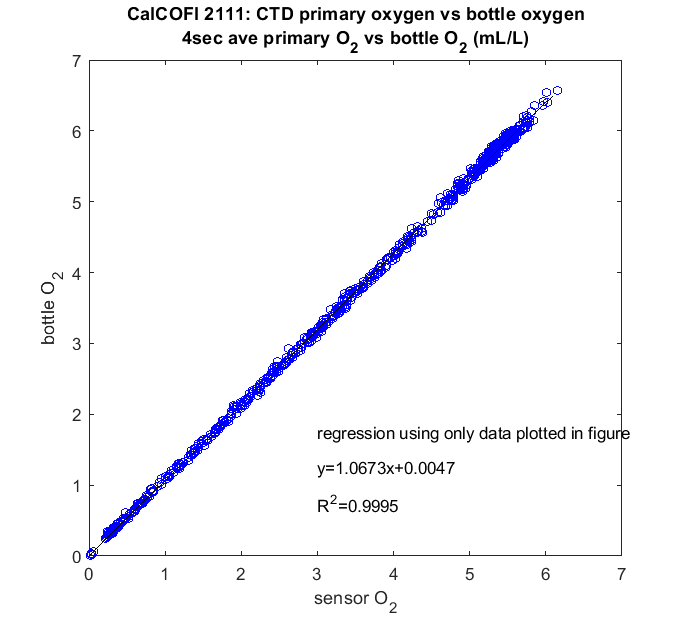
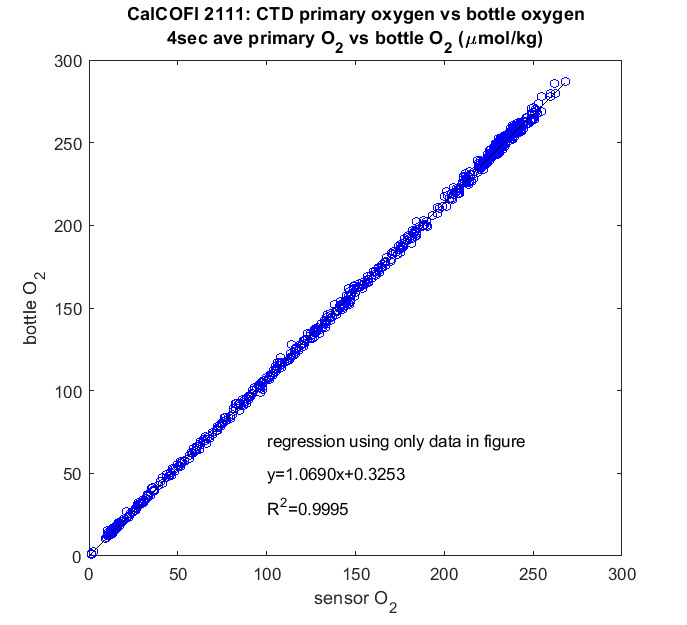
Derived by comparing sensor data (4 sec avg prior-to-bottle closure) to bottle samples.
Dual Salinity (Seabird SBE4) and Oxygen (Seabird SBE43) Sensors
PRIMARY SENSOR
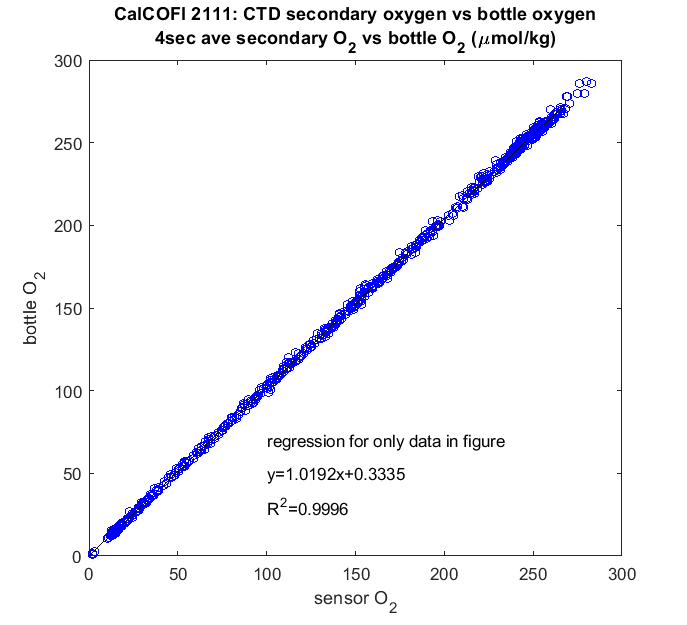
SECONDARY SENSOR
Salinity offset (bottle - sensor; > 350 m)
-0.0034
-0.0031
Oxygen ml/L
y = 1.0673x-0.0047; R² = 0.9995
y = 1.0176x - 0.0048; R² = 0.9996
Oxygen umol/Kg
y =1.0690x + 0.3253; R² = 0.9995
y = 1.0192x +0.3335; R² = 0.9996
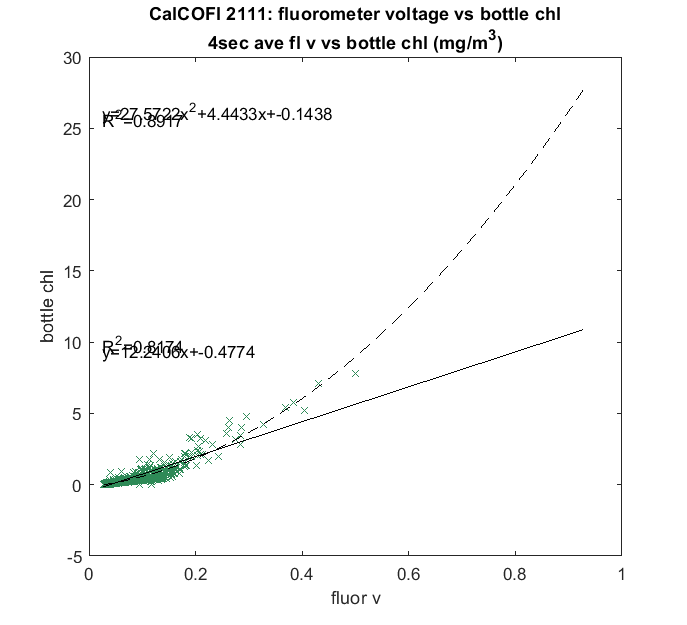
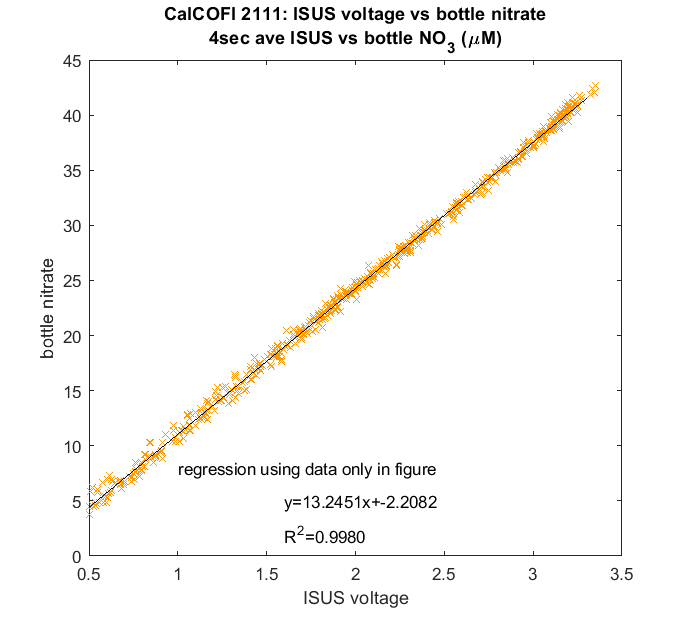
Single Nitrate (SBS Deep SUNA SN1560) and Fluorescence (Wetlabs ECO AFL/FL) Sensors
LINEAR
POLYNOMIAL
Nitrate
y = 13.2451x - 2.2082; R² = 0.9980
Fluorescence
y = 12.2406x - 0.4774; R² = 0.8174
y = 27.5722x2+ 4.4433x - 0.1438; R² = 0.8917
Regressions:
Please note: these regressions are generated from preliminary CTD vs bottle data and will be reprocessed once final bottle data are available. CTD temperatures and salinities do not usually change but oxygen, chlorophyll-a, and nitrate may change significantly after QAQC. Questionable or mistrip bottle data are removed from these comparisons but may be visible on the CTD.csv plots. For this cruise and future cruises, both primary & secondary sensor profiles vs bottle data will be generated and archived in the downloadable CTD+Bottle data files. These plots are under the “csv-plots\Primary” & “csv-plots\Secondary” subdirectories.