CalCOFI 1701RL sailed from 10th Ave Marine Terminal, San Diego Jan 05 2017 at 1300PST. The cruise was split into two legs due to severe weather off California Jan 20-24.
Leg I Jan 05 – 20: RV Reuben Lasker completed 75 stations successfully before returning to San Diego ~1730PST Jan 20.
Leg II 25 – 29 Jan: RV Reuben Lasker departed 10th Ave Marine Terminal at 0900PST 25 Jan and transited N to survey Lines 73, 70, 67, & 63. Remaining shiptime limited RV Reuben Lasker to 8 coastal stations & transects on these lines. CUFES surveying for eggs and performing two CTD profile-only casts per line (no seawater samples).
Please note: these data are 1m-bin-average Seasoft-processed CTD data that have not gone through quality control checks or bottle corrections. Anomalies are based on 50-year harmonics (1949-1999).
10 meter Preliminary CTD Data Contours
(Click for larger image)
10 meter Anomaly Contours (50 yr mean)
(Click for larger image)
100 meter Preliminary CTD Data Contours
(Click for larger image)
100 meter Anomaly Contours (50 yr mean)
(Click for larger image)
200 meter Preliminary CTD Data Contours
(Click for larger image)
200 meter Anomaly Contours (50 yr mean)
(Click for larger image)
300 meter Preliminary CTD Data Contours
(Click for larger image)
300 meter Anomaly Contours (50 yr mean)
(Click for larger image)
CTD Processing Notes
CTD Sensor Corrections:
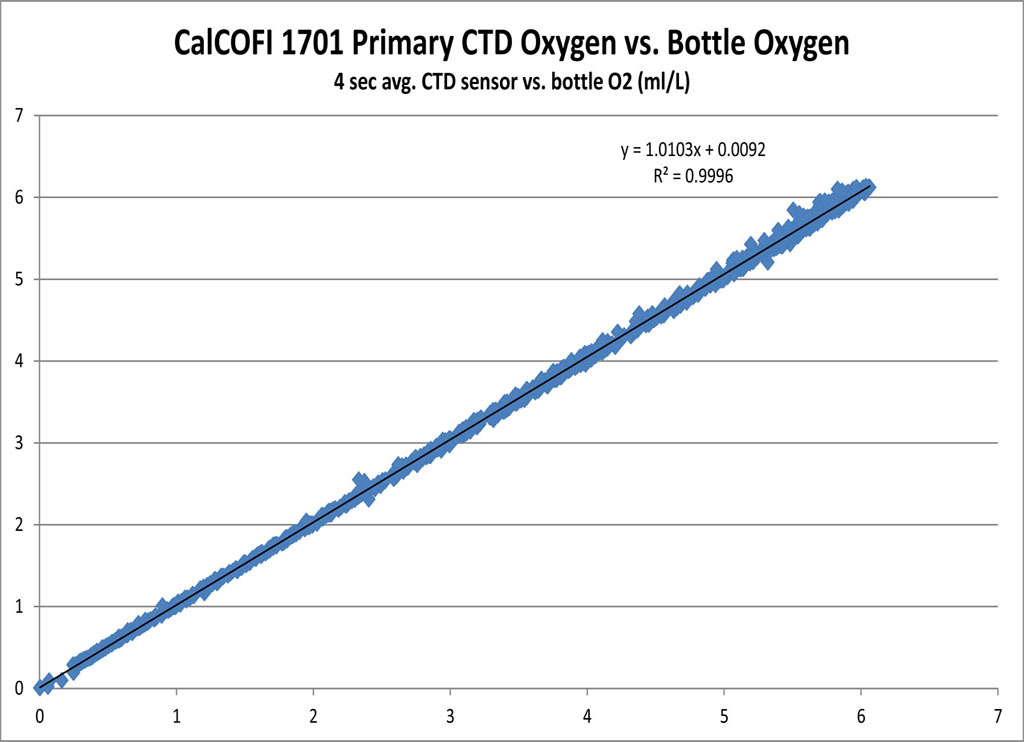
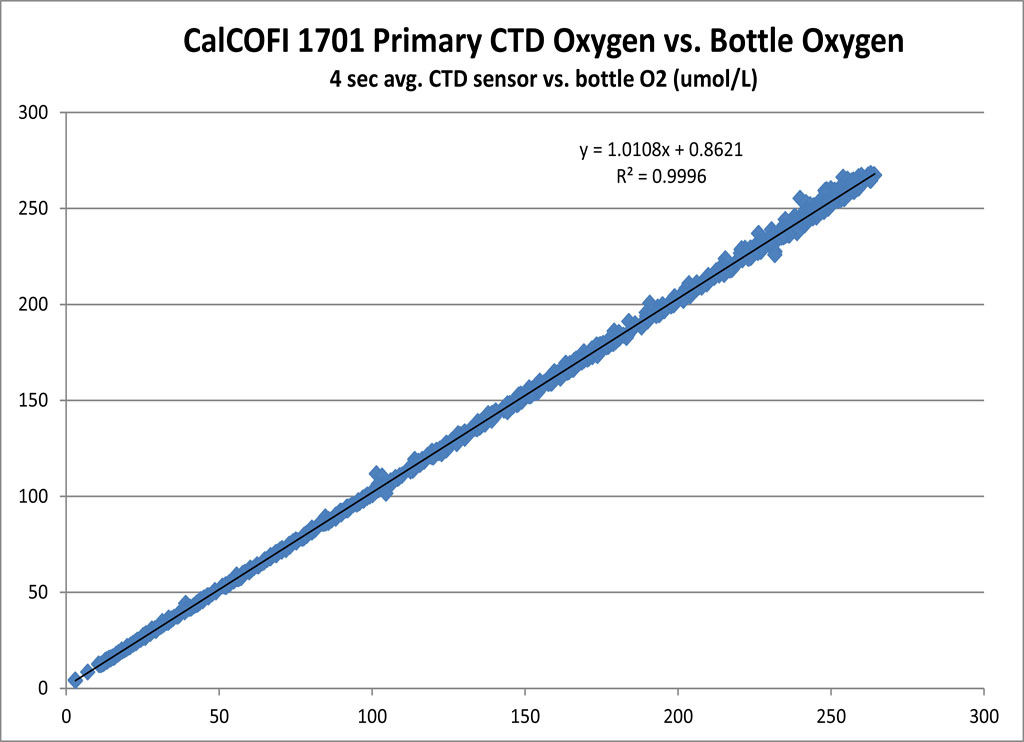
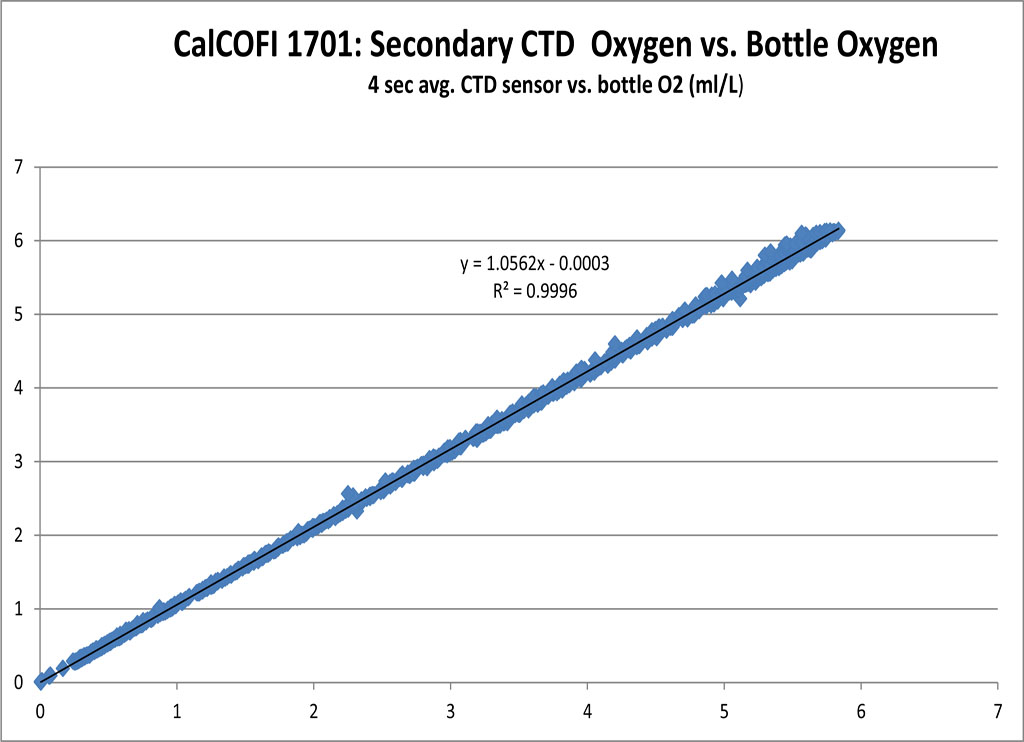
Derived by comparing sensor data (4 sec avg prior-to-bottle closure) to bottle samples.
Dual Salinity (Seabird SBE4) and Oxygen (Seabird SBE43) Sensors
PRIMARY SENSOR
SECONDARY SENSOR
Salinity offset (bottle - sensor; > 350 m)
-0.0004
0.0034
Oxygen ml/L
y = 1.0103x + 0.0092;
R² = 0.9996
y = 1.0562x - 0.0003;
R² = 0.9996
Oxygen umol/Kg
y =0.0108x + 0.8621;
R² = 0.9996
y = 1.0562x - 0.0003;
R² = 0.9996
Single Nitrate (Satlantic ISUS v3 SN111) and Fluorescence (Wetlabs ECO AFL/FL) Sensors
LINEAR
POLYNOMIAL
Nitrate
Cast 001 - 020
y = 36.489x - 1.3351;
R² = 0.9466
y = -18.449x2 + 57.489x - 2.2373;
R² = 0.9626
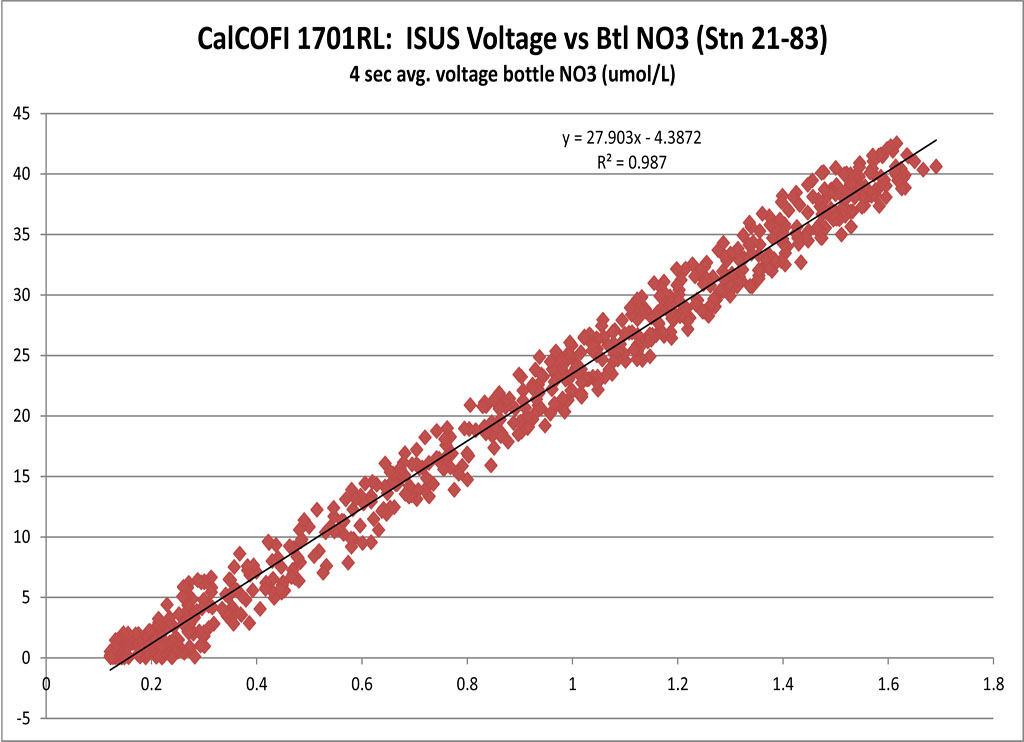
Nitrate
Cast 021 - 083
y = 27.903x - 4.3872;
R² = 0.987
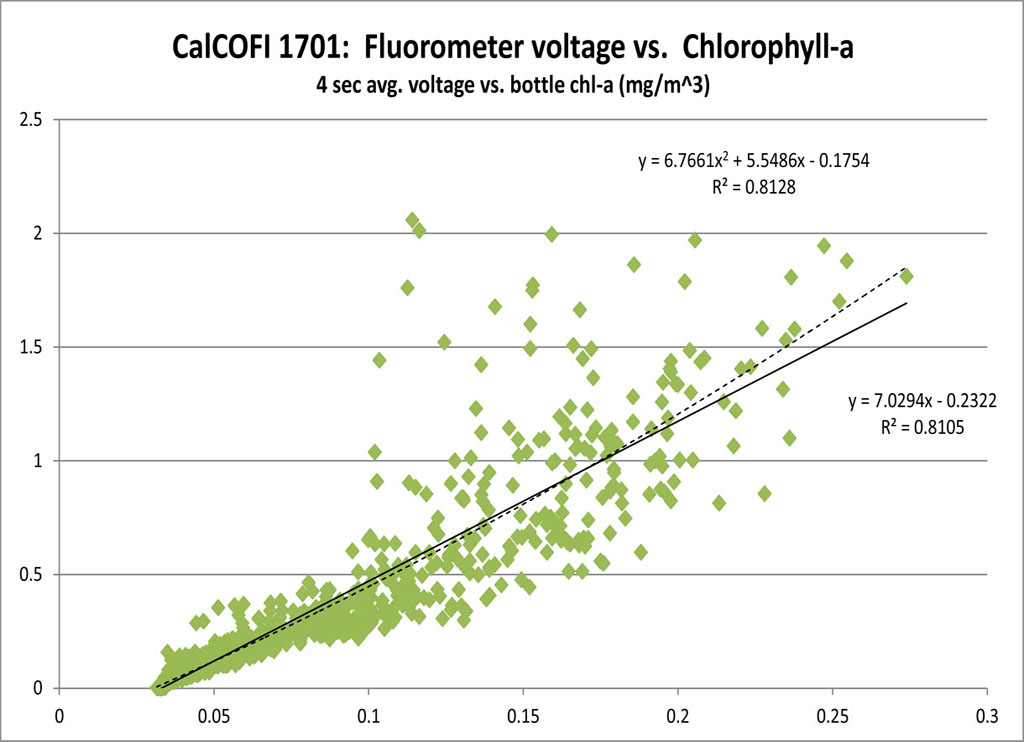
Fluorescence
y = 7.0294x - 0.2322;
R² = 0.8105
y = 6.7661x2 + 5.5486x - 0.1745;
R² = 0.8128
Regressions:
Please note: these regressions are generated from preliminary CTD vs bottle data and will be reprocessed once final bottle data are available. CTD temperatures and salinities do not usually change but oxygen, chlorophyll-a, and nitrate may change significantly after QAQC. Questionable or mistrip bottle data are removed from these comparisons but may be visible on the CTD.csv plots. For this cruise and future cruises, both primary & secondary sensor profiles vs bottle data will be generated and archived in the downloadable CTD+Bottle data files. These plots are under the “csv-plots\Primary” & “csv-plots\Secondary” subdirectories.