History
The California Cooperative Oceanic Fisheries Investigations (CalCOFI) program was formed in 1949 to study the ecological aspects of the Pacific sardine collapse off California. Since then, CalCOFI’s focus has broadened to encompass the ecosystem of the southern California Current System, while adapting to capitalize on state-of-the-art observing methods. Because of the length of the time series, the program is invaluable for understanding the effects of long-term change on the marine ecosystems and the human communities that depend on them within the California Current System, the North Pacific, and internationally.
October, 1989 video on ocean surveying by the California Cooperative Oceanic Fisheries Investigations (CalCOFI), produced by SIO for CalCOFI’s 40th anniversary. Narrated by Dr. Elizabeth Venrick who appears in several scenes. From SIO Archives collection 2005-42.
References Describing CalCOFI's History
The origin of CalCOFI through the decline of the Pacific sardine fishery
Created in the 1920s, the sardine fishery hit its peak in the 1930’s and the Pacific sardine (Sardinops sagax) quickly became the largest fishery on the North American Pacific coast. However, within a decade the fishery collapsed and all but disappeared from 1950-1970. The 1980’s saw the beginning of a slow recovery and the fishery has been gradually improving, for the most part, until recent declines after 2006. There have been several longstanding arguments as to the main source of the fishery’s initial collapse; the two most prominent being over fishing and changes in the environment. In an era that saw the vast downfall of the stock, the California Cooperative Oceanic Fisheries Investigations (CalCOFI) program was created to determine the true cause of sardine stock fluctuations.
In 1931, Norman Scofield predicted the potential collapse of the sardine fishery and recommended an annual catch limit of 200,000 tons per year. This sentiment was reiterated in 1939 by Frances Clark, who recommended the catch limit of 250,000 tons per year. Despite these recommendations, sardine landings peaked in the years of 1936-1937 at 791,334 tons. Of this catch, 726,124 tons were landed in California while the remaining was landed in the Pacific Northwest. By 1943-1944, overall landings declined to 579,129 tons, although landings for the Pacific Northwest peaked at 101,000 tons. The 1950s saw a significant and steady decline of sardine landings on the Pacific coast, reaching only 80,000 tons in the years 1954-1956. By 1965-1967, landings only comprised 20,000 tons.
The United States’ entry into WWII allowed for an expansion of naval and military research and led to greater research spending at institutions on the United States’ west coast. One of the primary recipients was the Scripps Institution of Oceanography, with growth in new programs such as sonar, naval electronic, wave and current studies, and microbiology. Despite this initial surge in research, the long term effects of war on the fisheries industry were less constructive. Over time, emphasis was placed on maximizing fisheries output over conservation and sustainability. Nevertheless, by 1950, focus once again shifted back to conservation and fisheries research. The creation of the CalCOFI program played a strong role during this period and the next two decades saw a dramatic increase and expansion of oceanographic knowledge and sampling capacity.
One of the main programs of the initial research spending was a group of investigations created to determine the cause of fluctuations in the sardine fishery. Former member of the Bureau of Fisheries, Oscar Elton Sette, took the lead as scientific adviser to the California Cooperative Sardine Research program. This program lasted from 1937-1949 and would later develop into present day CalCOFI. The original Marine Research committee was composed of nine members, with the majority actively involved in the industry and the remaining four from the California Fish and Game Commission, the Division of Fish and Game, and the California Academy of Sciences. Over the following decades, positions were granted to serve a greater range of representatives from the state, public and science sectors. What remained of the original Marine Research Committee was dissolved in the late 1970’s, and in its place remained the modern CalCOFI committee of three institutional representatives: NOAA, Scripps, and the California Department of Fish and Wildlife.
The California Cooperative Sardine Research investigations focused on how sardine were affected by numerous factors: including environment, food supply, predators and competitors. The findings of these field studies from the 1920s, 1930s and 1940s are now known as the CalCOFI Reports and are indexed under the title California Cooperative Oceanic Fisheries Investigations Reports. Over time, the members of CalCOFI developed competing hypotheses for the fluctuation in the sardine stock: that the dwindling of fish stock was either the result of unfavorable environmental conditions or the result of overfishing. Initially environmental conditions were deemed to be the primary cause of the sardine stock decline; however, over time the survey observations showed that fishing pressure also had a definitive effect on the stock.
As scientific advisor, Oscar Sette had a direct influence on the focus of the California Cooperative Sardine Research program. Sette was a student of Henry Bryant Bigelow, who in turn was strongly influenced by Johan Hjort. Hjort was a prime proponent of the argument for environmental influence on the year class strength of fishes, primarily that displacement from a favorable environment would influence greater mortality. This hypothesis would strongly influence the directive of CalCOFI through proponents such as John Marr from USBCF and was largely maintained over the next decades. Nevertheless, by 1955, the hypothesis of overfishing became equally popular within the research community through advocates such as Frances Clark from CDFG. In correspondence with these competing hypotheses, by the early 1960’s it became apparent that the sardine stocks were both suffering from spawning success through key disturbances in the environment in addition to being over-fished. A third hypothesis arose in the 1970’s and 1980’s in the form of a link between predation and recruitment success of small pelagic fishes such as anchovy and sardine. Mortality due to predation would influence recruitment success. Decades later, scientists’ current view partially integrates all three of these competing hypothesis; allowing that each provide different levels of influence at any one time but all contribute to the consistently fluctuating sardine biomass.
Since its inception, the CalCOFI program has grown in their efforts to better the sampling effort and expand the volume of oceanographic knowledge. The causes of sardine stock fluctuations have been shown to be a number of influencing and interworking factors. The species focus has broadened from solely sardine to understanding fluctuations in both commercially exploited and unfished species. Today, the goal of CalCOFI has developed into an overall understanding of the fluctuations and long term changes of the California Current Ecosystem (CCE) and is continuously investigated and supplemented through a number of important ancillary, but shorter duration, programs.
Progress Report 1950 (CalCOFI Report, Volume 1)
THE PROBLEM
In order to develop plans for the responsible management of the sardine resource and to attempt to derive workable methods of predicting where sardines will he found and in what quantities, it is imperative to know
certain underlying principles which govern the sardine’s behavior, availability, and total abundance. Work under the California Cooperative Sardine Research Program is aimed at determining those principles.METHOD OF ATTACK
The four agencies participating in the program are investigating the Pacific sardine in relation to its physical and chemical environment, its food supply, its predators and its competitors, and attempting to evaluate the findings in terms of the survival of young and in terms of the distribution and availability of the sardines
when they reach commercial size.RECENT FINDINGS
The 1950 cruises have confirmed the 1949 finding that there are at present two centers of heavy sardine spawning off our coast. The first is in the vicinity of Cedros Island, off Baja California, and is relatively restricted in area; the second is off Southern California and northern Baja California. It covers the larger area; within it, though, spawning is more diffuse than near Cedros Island.During the spring of 1950, surface temperatures were lower than they were in 1949, which may indicate more intense upwelling during the season.
The cruises for 1949 and 19.50 have shown that most sardine spawning takes place within narrow temperature ranges. During the 1950 spawning season 98.4 percent of all sardine eggs sampled were taken in waters
between 12.5° and 16°C. (54.5° and 60.8°F.).Under laboratory conditions, sardines have been shown to exhibit predictable behavior patterns in the presence of electrical fields. Larger-scale studies of this subject are planned.
Length and age studies of the commercial catch show that during both the 1948-49 and 1949-50 seasons the major support of the fishery came from the 1946 and 1947 year classes. There are no indications as yet that the 1948 and 1949 year classes will appear at the fishing grounds in exceptional numbers. It is still too early to attempt to assess the 1950 year class. The 1946 and 1947 groups will presumably have to supply much of the tonnage taken in the next two or three years.
Studies of the mechanism of upwelling, a factor that may be of great importance in the sardine problem, have shown that spring and summer upwelling of Cape Mendocino and Point Conception can be correlated with weather conditions.
The first two full years of work under the program have brought the development of important new instruments for oceanographic research, the accumulation and partial analysis of a great mass of data on the offshore waters, the development and refinement of the techniques of collecting and processing the data.
PLANS FOR 1951
In the main, work under the California Cooperative Sardine Research Program will continue along the present lines during 1951. The seagoing work cannot as yet be curtailed or simplified without running the risk of failing to obtain information of basic importance. Any changes will be those dictated by the necessity of
studying changing oceanographic and biological conditions. Both at sea and ashore, several new studies that promise to enlarge our understanding of the Pacific sardine will be pursued.
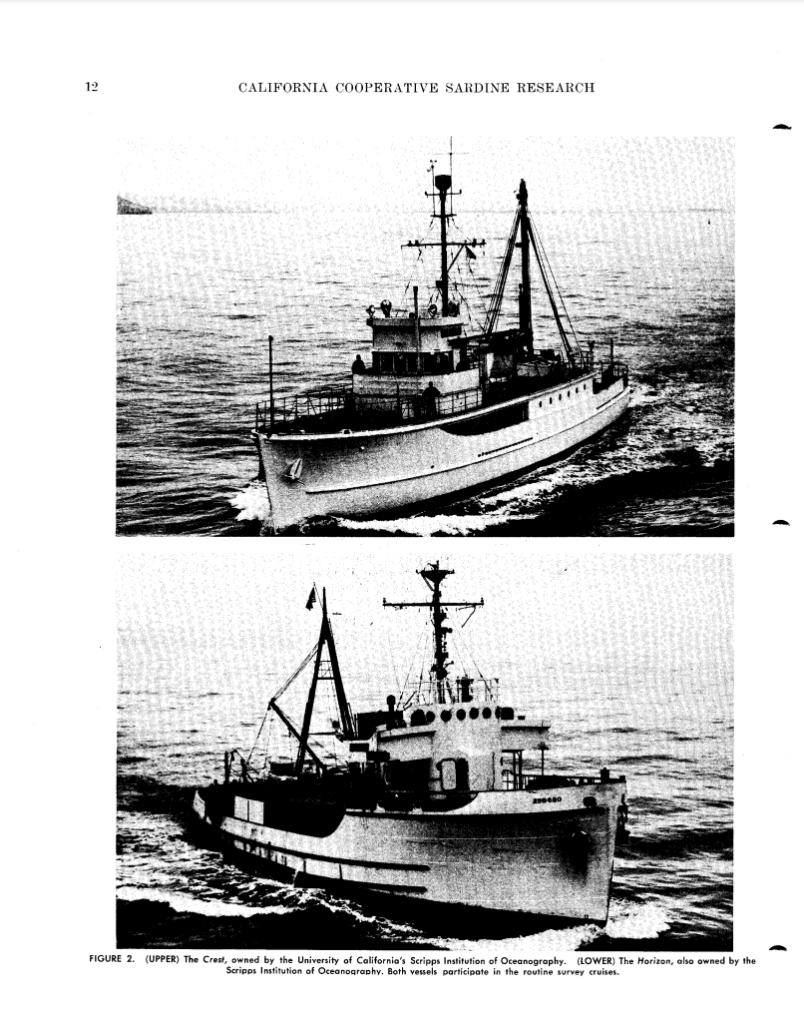
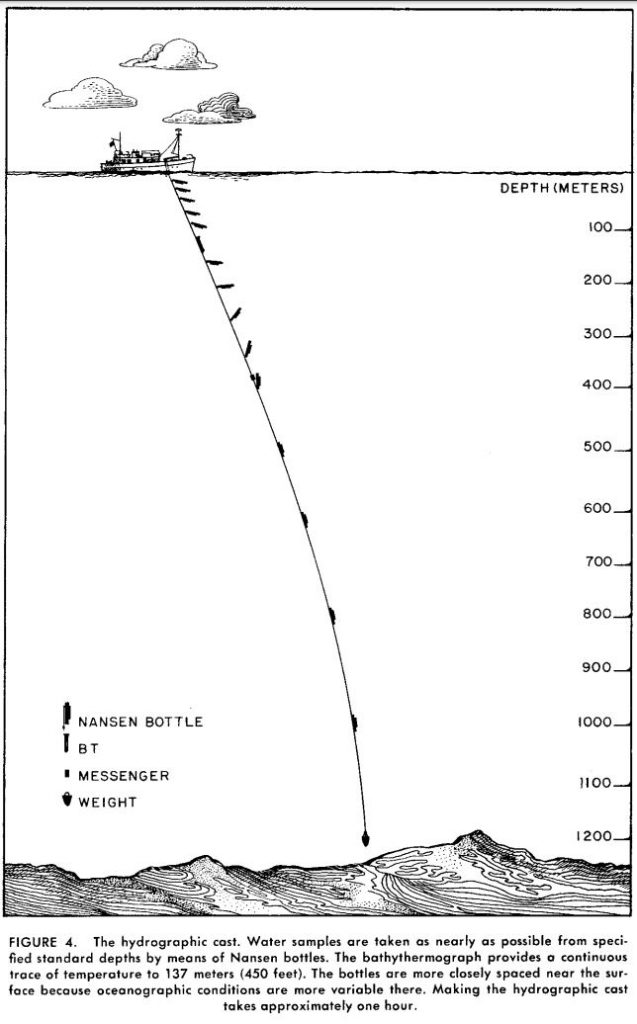
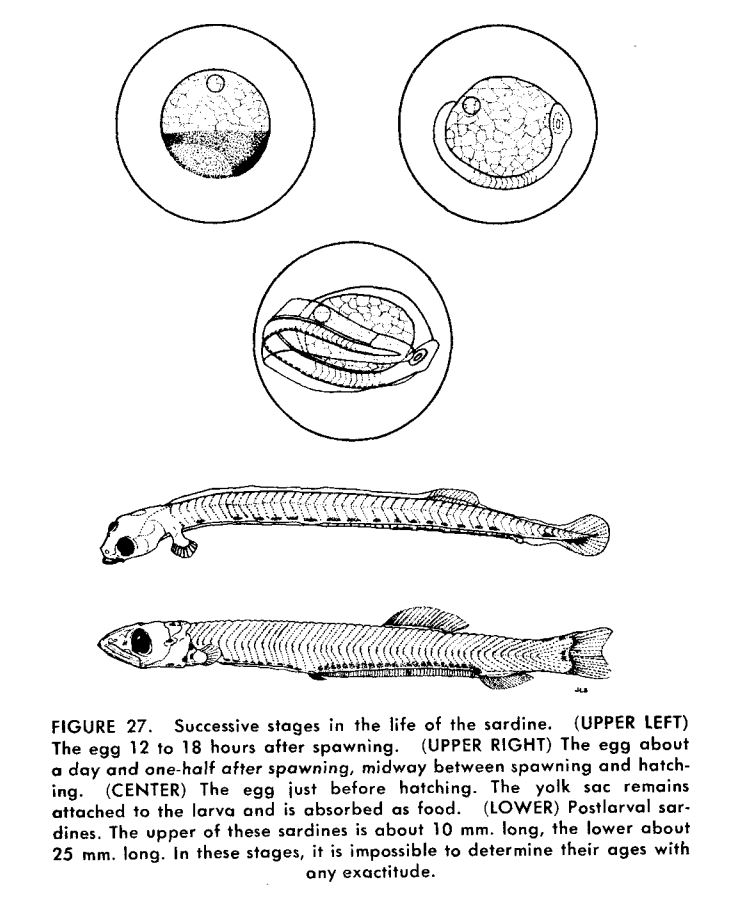
See Volume 1, and other CalCOFI Reports, for historical figures and information
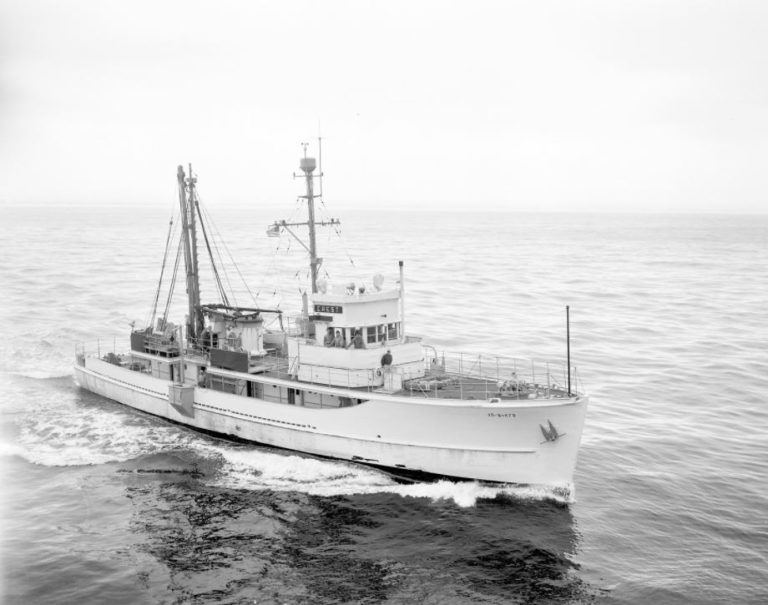
Also see Scripps Institution of Oceanography’s History Website and view the 1989 40th Anniversary video
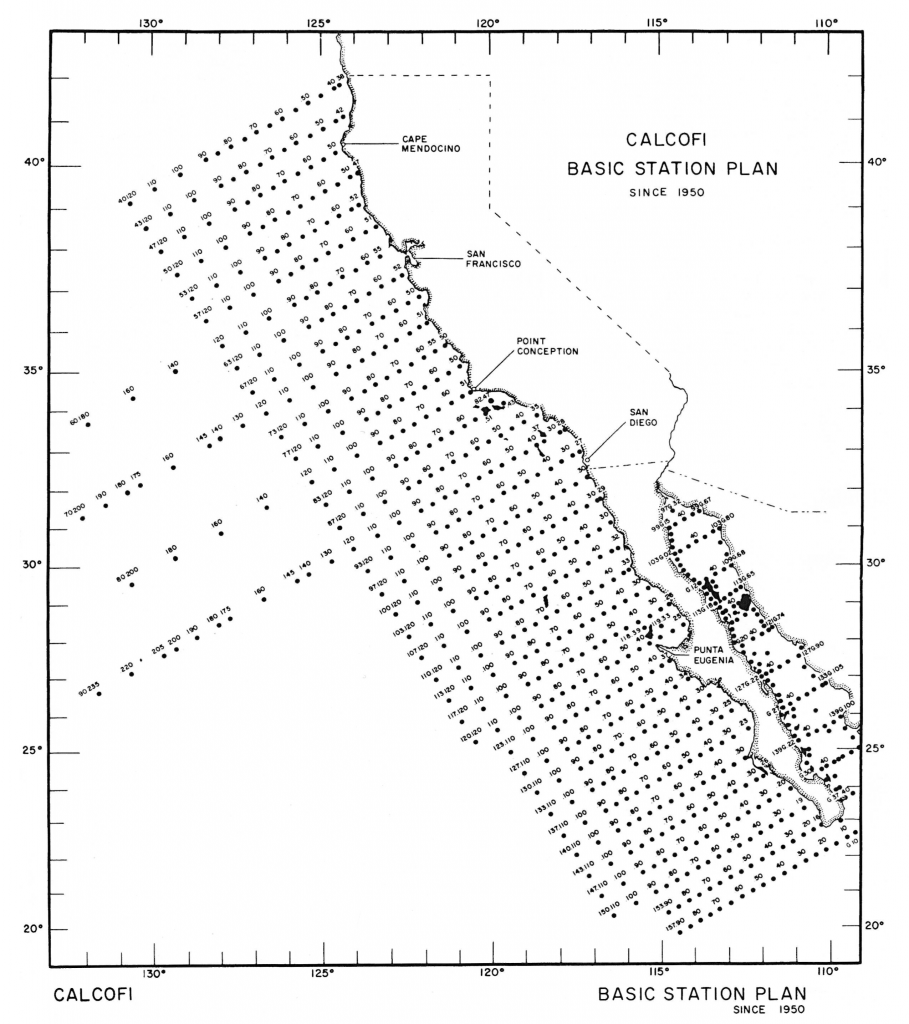
Historical Station Pattern
Currently, the program conducts quarterly cruises to collect hydrographic and biological data from the 75 station pattern and the 113 station pattern. See the original station pattern (below) that was used in 1950.
Survey Coverage 1937 - Present
Visual representation of temporal and spatial sampling coverage of CalCOFI cruises
CalCOFI cruises typically take place four times a year, but when CalCOFI first started, there were as many as 12 cruises a year. See our survey coverage figure below for temporal and spatial coverage of CalCOFI surveys conducted 1937 to present.
Cruises from 1937 through 1987 are adapted from Hewitt, R.P. 1988 – Historical review of the oceanographic approach to fishery research (Vol XXIX on the CalCOFI Reports page). Cruises from 1988 to present are drawn from published CalCOFI data reports and recent unpublished data.
104 Station Pattern Map (Winter & Spring) | 75 Station Pattern Map (Summer & Fall)
|
Year |
January |
February |
March |
April |
May |
June |
July |
August |
Sept. |
October |
Nov. |
Dec. |
Year |
| 2020 |
|
 |
 |
2020 | |||||||||
| 2019 |
 |
 |
 |
 |
2019 | ||||||||
| 2018 |
 |
 |
 |
 |
2018 | ||||||||
| 2017 |
|
 |
 |
 |
2017 | ||||||||
| 2016 |
 |
 |
 |
 |
2016 | ||||||||
| 2015 |
 |
 |
 |
 |
2015 | ||||||||
| 2014 |
|
 |
 |
 |
 |
2014 | |||||||
| 2013 |
|
|
 |
 |
2013 | ||||||||
| 2012 |
|
 |
|
|
2012 | ||||||||
| 2011 |
 |
 |
|
|
2011 | ||||||||
| 2010 |
|
|
|
 |
2010 | ||||||||
|
Year |
January |
February |
March |
April |
May |
June |
July |
August |
Sept. |
October |
Nov. |
Dec. |
Year |
|
2009 |
|
|
|
|
|
|
|
|
|
|
|
|
2009 |
|
2008 |
|
|
|
|
|
|
|
|
|
|
|
|
2008 |
|
2007 |
|
|
|
|
|
|
|
|
|
|
|
|
2007 |
|
2006 |
|
|
|
|
|
|
|
|
|
|
|
|
2006 |
|
2005 |
|
|
|
|
|
|
|
|
|
|
|
|
2005 |
|
2004 |
|
|
|
|
|
|
|
|
|
|
|
|
2004 |
|
2003 |
|
|
|
|
|
|
|
|
|
|
|
|
2003 |
|
2002 |
|
|
|
|
|
|
|
|
|
|
|
|
2002 |
|
2001 |
|
|
|
|
|
|
|
|
|
|
|
|
2001 |
|
2000 |
|
|
|
|
|
|
|
|
|
|
|
|
2000 |
|
Year |
January |
February |
March |
April |
May |
June |
July |
August |
Sept. |
October |
Nov. |
Dec. |
Year |
|
1999 |
|
|
|
|
|
|
|
|
|
|
|
|
1999 |
|
1998 |
|
|
|
|
|
|
|
|
|
|
|
|
1998 |
|
1997 |
|
|
|
|
|
|
|
|
|
|
|
|
1997 |
|
1996 |
|
|
|
|
|
|
|
|
|
|
|
|
1996 |
|
1995 |
|
|
|
|
|
|
|
|
|
|
|
|
1995 |
|
1994 |
|
|
|
|
|
|
|
|
|
|
|
|
1994 |
|
1993 |
|
|
|
|
|
|
|
|
|
|
|
|
1993 |
|
1992 |
|
|
|
|
|
|
|
|
|
|
|
|
1992 |
|
1991 |
 |
|
 |
|
|
|
|
|
|
|
|
|
1991 |
|
1990 |
|
|
 |
 |
|
|
|
|
|
|
|
|
1990 |
|
Year |
January |
February |
March |
April |
May |
June |
July |
August |
Sept. |
October |
Nov. |
Dec. |
Year |
|
1989 |
|
|
|
|
|
|
|
|
|
|
|
|
1989 |
|
1988 |
|
|
|
|
 |
|
|
|
|
|
|
|
1988 |
|
1987 |
|
|
|
|
|
|
|
|
 |
|
|
|
1987 |
|
1986 |
|
 |
|
|
|
|
|
|
 |
|
 |
|
1986 |
|
1985 |
|
 |
|
|
|
|
 |
|
|
|
 |
|
1985 |
|
1984 |
|
 |
|
 |
|
|
 |
|
|
|
|
|
1984 |
|
1983 |
|
 |
|
 |
|
|
 |
|
 |
|
 |
|
1983 |
|
1982 |
|
|
|
|
|
|
|
|
|
|
|
|
1982 |
|
1981 |
|
 |
|
 |
|
|
 |
|
|
|
|
|
1981 |
|
1980 |
|
|
|
|
|
|
|
|
|
|
|
|
1980 |
|
Year |
January |
February |
March |
April |
May |
June |
July |
August |
Sept. |
October |
Nov. |
Dec. |
Year |
|
1979 |
|
|
|
|
|
|
|
|
|
|
|
|
1979 |
|
1978 |
|
|
|
|
|
|
|
|
|
|
|
|
1978 |
|
1977 |
|
|
|
|
|
|
|
|
|
|
|
|
1977 |
|
1976 |
|
|
|
|
|
|
|
|
|
|
|
|
1976 |
|
1975 |
|
|
|
|
|
|
|
|
|
|
|
|
1975 |
|
1974 |
|
|
|
|
|
|
|
|
|
|
|
|
1974 |
|
1973 |
|
|
|
|
|
|
|
|
|
|
|
|
1973 |
|
1972 |
|
|
|
|
|
|
|
|
|
|
|
|
1972 |
|
Year |
January |
February |
March |
April |
May |
June |
July |
August |
Sept. |
October |
Nov. |
Dec. |
Year |
|
1970 - 1971 No data |
|||||||||||||
|
1969 |
|
|
|
|
|
|
|
|
|
|
|
|
1969 |
|
1968 |
|
|
|
|
|
|
|
|
|
|
|
|
1968 |
|
1967 |
|
|
|
|
|
|
|
|
|
|
|
|
1967 |
|
1966 |
|
|
|
|
|
|
|
|
|
|
|
|
1966 |
|
1965 |
 |
|
|
 |
 |
|
 |
|
 |
|
|
|
1965 |
|
1964 |
 |
|
|
 |
|
|
 |
|
|
 |
|
|
1964 |
|
1963 |
 |
|
|
 |
|
|
 |
|
 |
 |
 |
|
1963 |
|
1962 |
 |
|
|
 |
|
|
 |
|
|
 |
|
 |
1962 |
|
1961 |
 |
|
 |
 |
 |
|
 |
 |
 |
 |
|
|
1961 |
|
1960 |
|
|
|
 |
|
 |
|
|
|
|
|
|
1960 |
|
Year |
January |
February |
March |
April |
May |
June |
July |
August |
Sept. |
October |
Nov. |
Dec. |
Year |
|
1959 |
|
|
|
 |
|
 |
|
|
|
|
|
|
1959 |
|
1958 |
|
|
|
 |
|
 |
|
|
|
|
|
|
1958 |
|
1957 |
|
|
|
 |
|
 |
|
|
|
|
|
|
1957 |
|
1956 |
|
|
|
 |
|
 |
|
|
|
|
|
|
1956 |
|
1955 |
|
|
|
 |
|
 |
|
|
|
|
|
|
1955 |
|
1954 |
|
|
|
 |
|
 |
|
|
|
|
|
|
1954 |
|
1953 |
|
|
|
 |
|
 |
|
|
|
|
|
|
1953 |
|
1952 |
|
|
|
 |
|
 |
|
|
|
|
|
|
1952 |
|
1951 |
|
|
|
 |
|
 |
|
|
|
|
|
|
1951 |
|
1950 |
|
|
|
 |
|
 |
|
|
|
|
|
|
1950 |
|
1949 |
|
|
|
 |
|
 |
|
|
|
|
|
|
1949 |
|
1942 - 1948 No data |
|||||||||||||
|
1941 |
|
|
 |
 |
 |
 |
 |
|
 |
 |
|
|
1941 |
|
1940 |
|
|
 |
 |
 |
 |
|
|
|
|
|
|
1940 |
|
1939 |
|
|
 |
|
|
 |
|
|
|
|
|
|
1939 |
|
1938 |
|
 |
|
 |
|
 |
|
|
|
|
|
 |
1938 |
|
1937 |
|
|
 |
|
 |
 |
|
|
|
|
|
|
1937 |
