CalCOFI 1604SH on NOAA Ship Bell M. Shimada left San Diego 01 Apr 2016, successfully occupied 101.5 station and offloaded in San Francisco 23 Apr 2016. Sta 60.90 was the “0.5” station since net tows were performed but the CTD-rosette cast was cancelled due to marginal conditions. Navy ops near San Nicolas Island created a westward transit delay so coastal station work on line 83 was performed before stations west of 86.7 35 – refer to the station map for station work & sequence. Later, additional Navy ops required us to move north of line 80 and work stations on line 76.7 before line 80. Unfortunately, the weather got rough as we started line 80 offshore and two important stations, 80.80 and 80.70, were missed due to bad weather. After finishing sta 80.55, completing the 75-sta standard pattern, personnel were dropped off 16 Apr in Santa Barbara. CTD-rosette operations on the remaining lines, 73.3, 70.0, 66.7, 63.3, & 60.0, were sampled using a 12-bottle rosette, reducing the analytical sample load. NOAA Ship Bell M. Shimada came into San Francisco’s Pier 30/32 0800 23 Apr 2016 to offload. Gear and bins were loaded onto trucks 24 Apr 2016, trucked to San Diego, and offloaded 25 Apr 2016.
Please note: these data are 1m-bin-average Seasoft-processed CTD data that have not gone through quality control checks or bottle corrections. Anomalies are based on 50-year harmonics (1949-1999).
10 meter Preliminary CTD Data Contours
(Click for larger image)
10 meter Anomaly Contours (50 yr mean)
(Click for larger image)
100 meter Preliminary CTD Data Contours
(Click for larger image)
100 meter Anomaly Contours (50 yr mean)
(Click for larger image)
200 meter Preliminary CTD Data Contours
(Click for larger image)
200 meter Anomaly Contours (50 yr mean)
(Click for larger image)
300 meter Preliminary CTD Data Contours
(Click for larger image)
300 meter Anomaly Contours (50 yr mean)
(Click for larger image)
CTD Processing Notes
CTD Sensor Corrections:
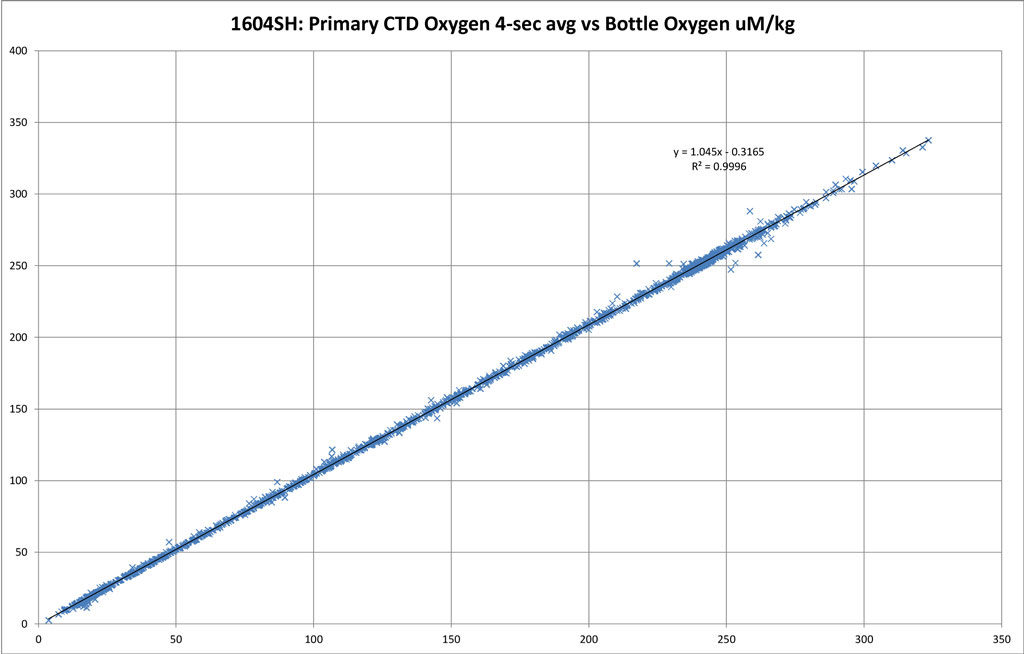
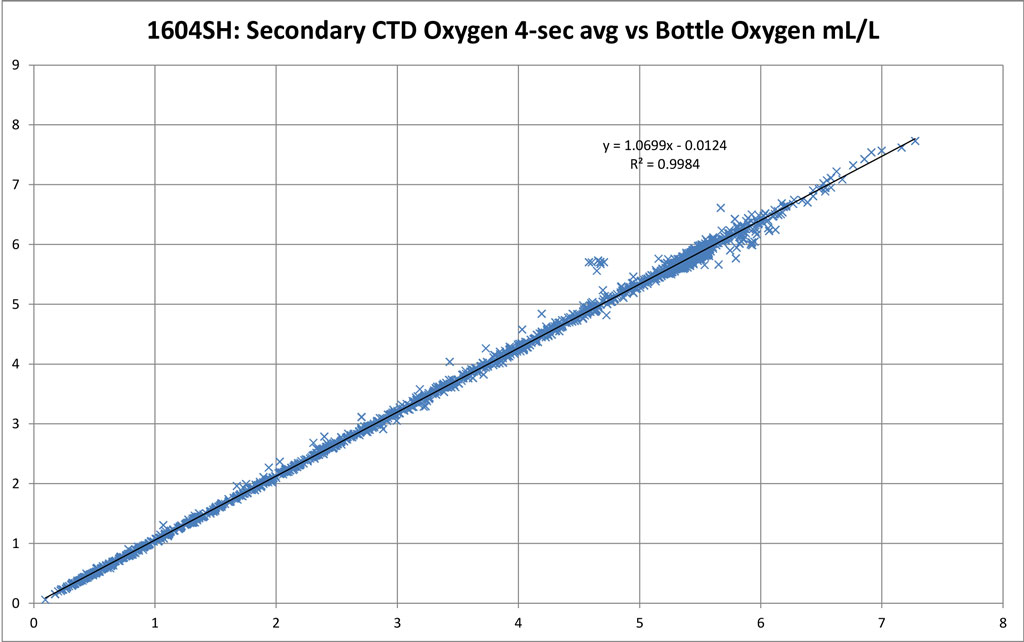
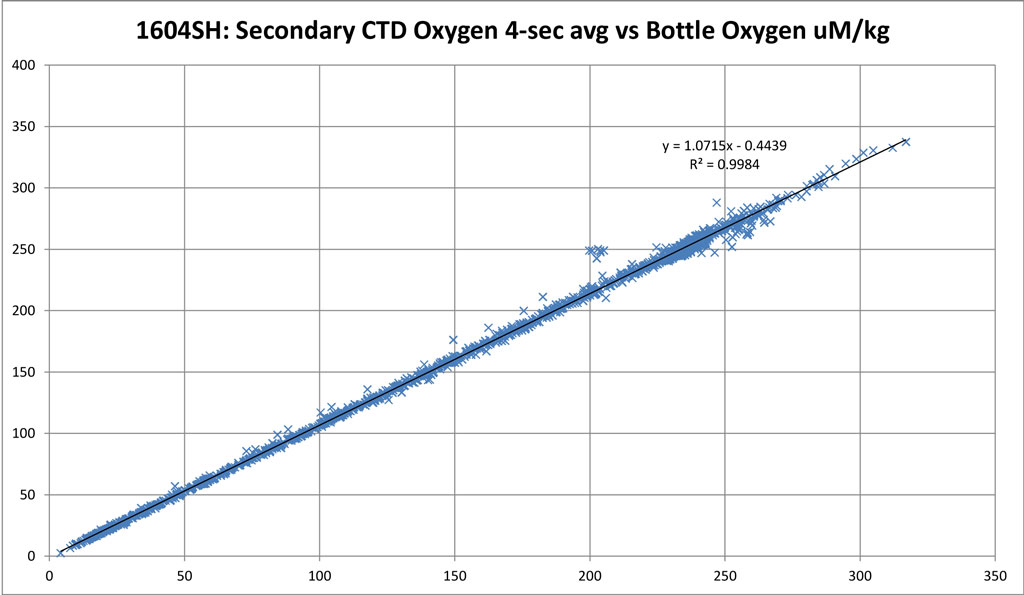
Derived by comparing sensor data (4 sec avg prior-to-bottle closure) to bottle samples.
Dual Salinity (Seabird SBE4) and Oxygen (Seabird SBE43) Sensors
PRIMARY SENSOR
SECONDARY SENSOR
Salinity offset (bottle - sensor; > 350 m)
-0.0011
0.0035
Oxygen ml/L
y = 1.0435x - 0.0094;
R² = 0.9996
y = 1.0699x - 0.0124;
R² = 0.9984
Oxygen umol/Kg
y = 1.045x - 0.3165;
R² = 0.9996
y = 1.0715x - 0.4439;
R² = 0.9984
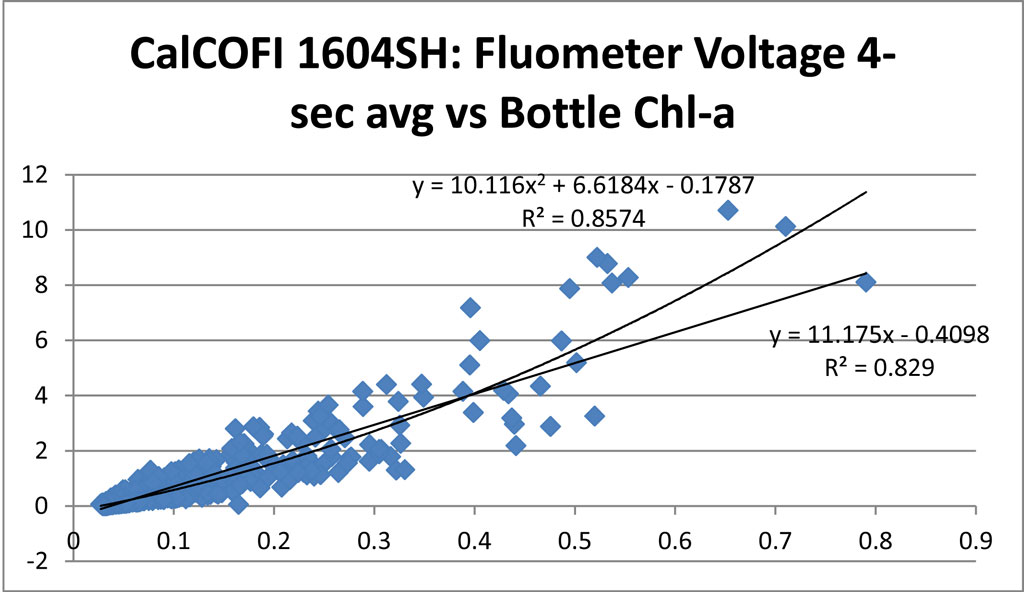
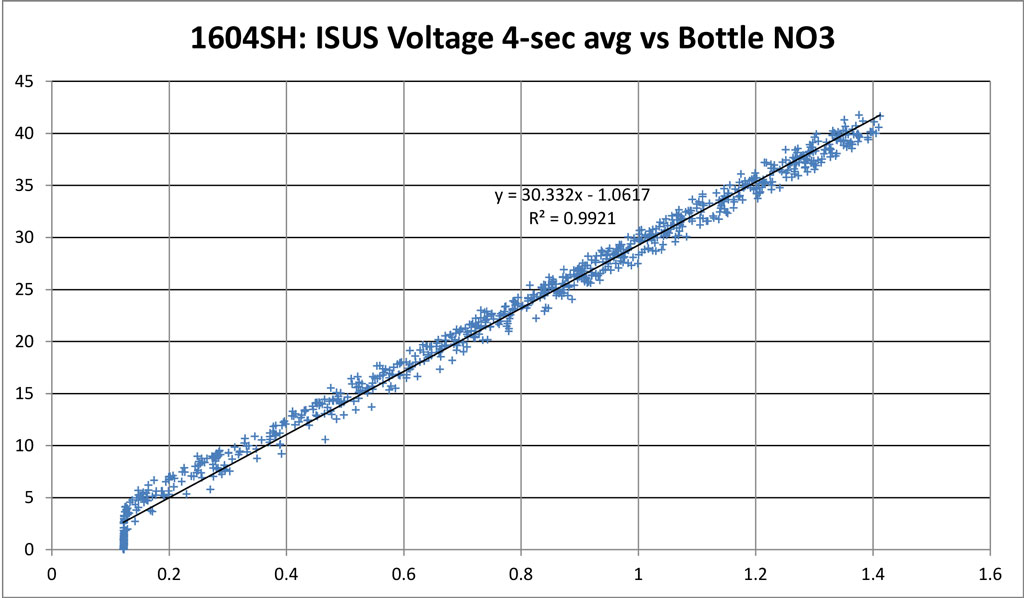
Single Nitrate (Satlantic ISUS v3 SN111) and Fluorescence (Wetlabs ECO AFL/FL) Sensors
LINEAR
POLYNOMIAL
Nitrate
y = 30.332x - 1.062;
R² = 0.9921
Fluorescence
y = 11.175x - 0.4098;
R² = 0.829
y = 10.116x² + 6.6184x - 0.1787;
R² = 0.8574
Regressions:
Please note: these regressions are generated from preliminary CTD vs bottle data and will be reprocessed once final bottle data are available. CTD temperatures and salinities do not usually change but oxygen, chlorophyll-a, and nitrate may change significantly after QAQC. Questionable or mistrip bottle data are removed from these comparisons but may be visible on the CTD.csv plots. For this cruise and future cruises, both primary & secondary sensor profiles vs bottle data will be generated and archived in the downloadable CTD+Bottle data files. These plots are under the “csv-plots\Primary” & “csv-plots\Secondary” subdirectories.