CalCOFI 1607OS sailed from 10th Ave Marine Terminal San Diego July 10 2016 at 0800PDT and returned as scheduled July 27 2016. Offloading started upon arrival to San Diego. 68 stations (60 standard and 8 SCCOOS stations) were successfully occupied. Please refer to the preliminary data plots web page and data links below for preliminary data. The typical 75-station summer station pattern was scheduled but due to high winds and rough seas west of Pt. Conception, ~ 26 hours were lost. All of Line 80 stations were completed but several stations on Line 77 were missed as ship-time ran out due to weather delays and long transit times. Stations missed: 77.100, 77.70, 77.60, 77.55, 77.51, 77.49, SCCOOS 85.8 35.8.
Please note: these data are 1m-bin-average Seasoft-processed CTD data that have not gone through quality control checks or bottle corrections. Anomalies are based on 50-year harmonics (1949-1999).
10 meter Preliminary CTD Data Contours
(Click for larger image)
10 meter Anomaly Contours (50 yr mean)
(Click for larger image)
100 meter Preliminary CTD Data Contours
(Click for larger image)
100 meter Anomaly Contours (50 yr mean)
(Click for larger image)
200 meter Preliminary CTD Data Contours
(Click for larger image)
200 meter Anomaly Contours (50 yr mean)
(Click for larger image)
300 meter Preliminary CTD Data Contours
(Click for larger image)
300 meter Anomaly Contours (50 yr mean)
(Click for larger image)
CTD Processing Notes
CTD Sensor Corrections:
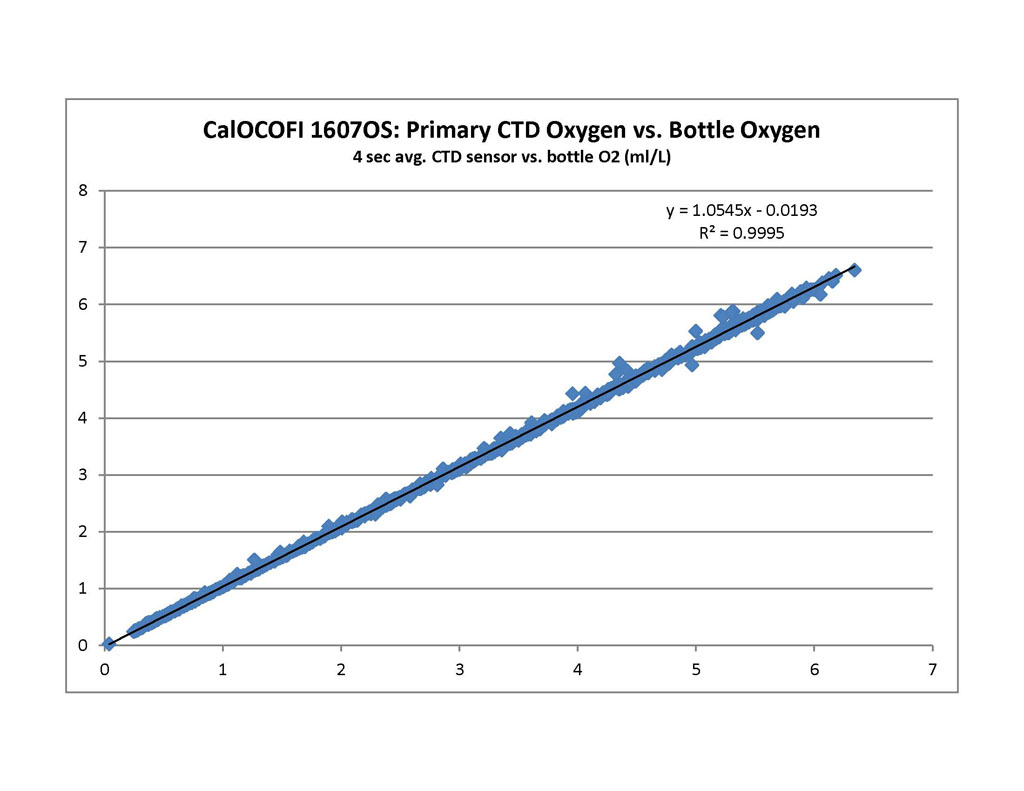
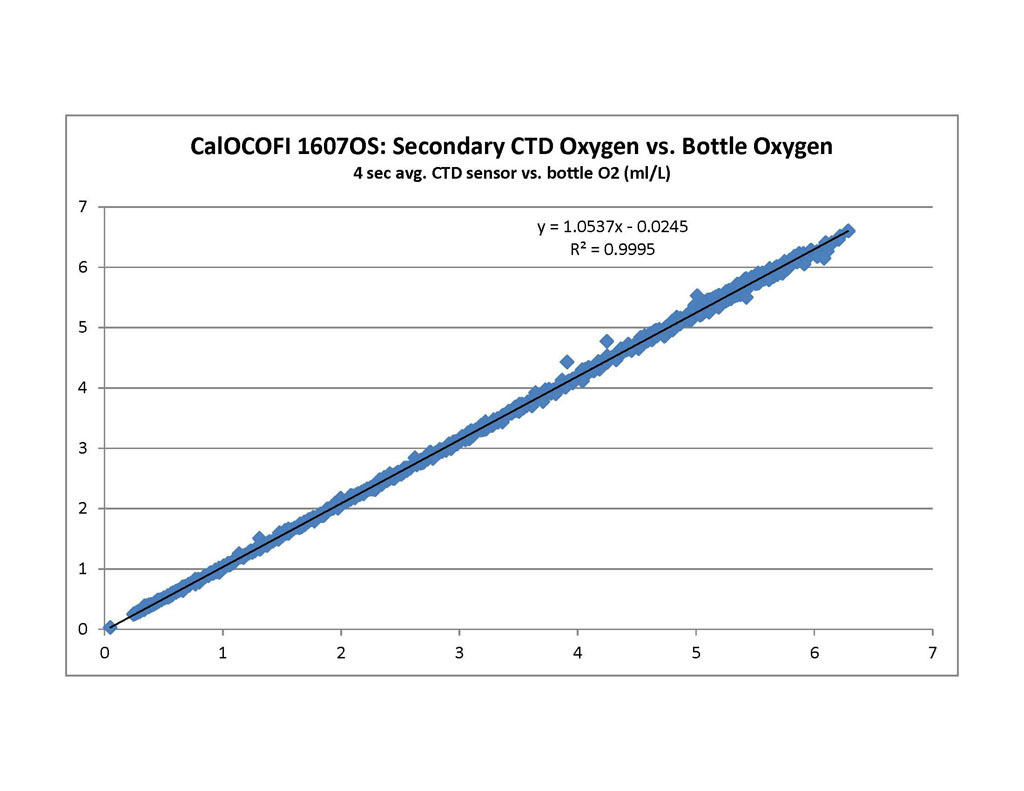
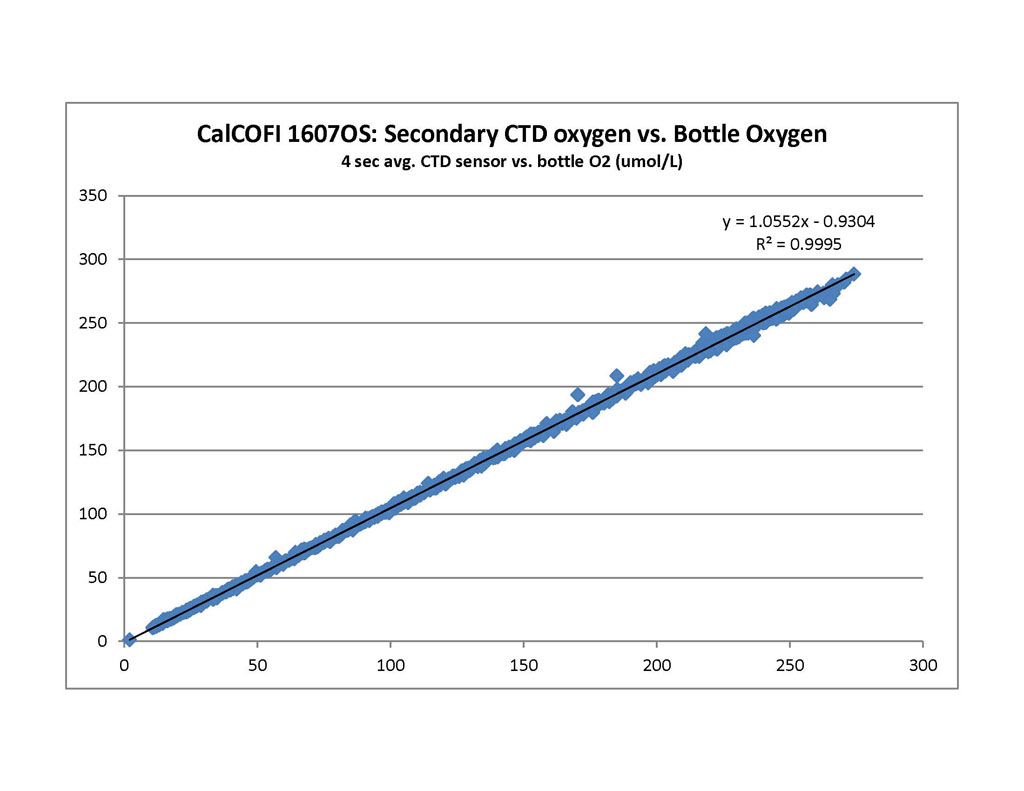
Derived by comparing sensor data (4 sec avg prior-to-bottle closure) to bottle samples.
Dual Salinity (Seabird SBE4) and Oxygen (Seabird SBE43) Sensors
PRIMARY SENSOR
SECONDARY SENSOR
Salinity offset (bottle - sensor; > 350 m)
-0.0016
0.0053
Oxygen ml/L
y = 1.0545x - 0.0193;
R² = 0.9995
y = 1.0537x - 0.0245;
R² = 0.9995
Oxygen umol/Kg
y = 1.056x - 0.7146;
R² = 0.9996
y = 1.0552x - 0.9304;
R² = 0.9995
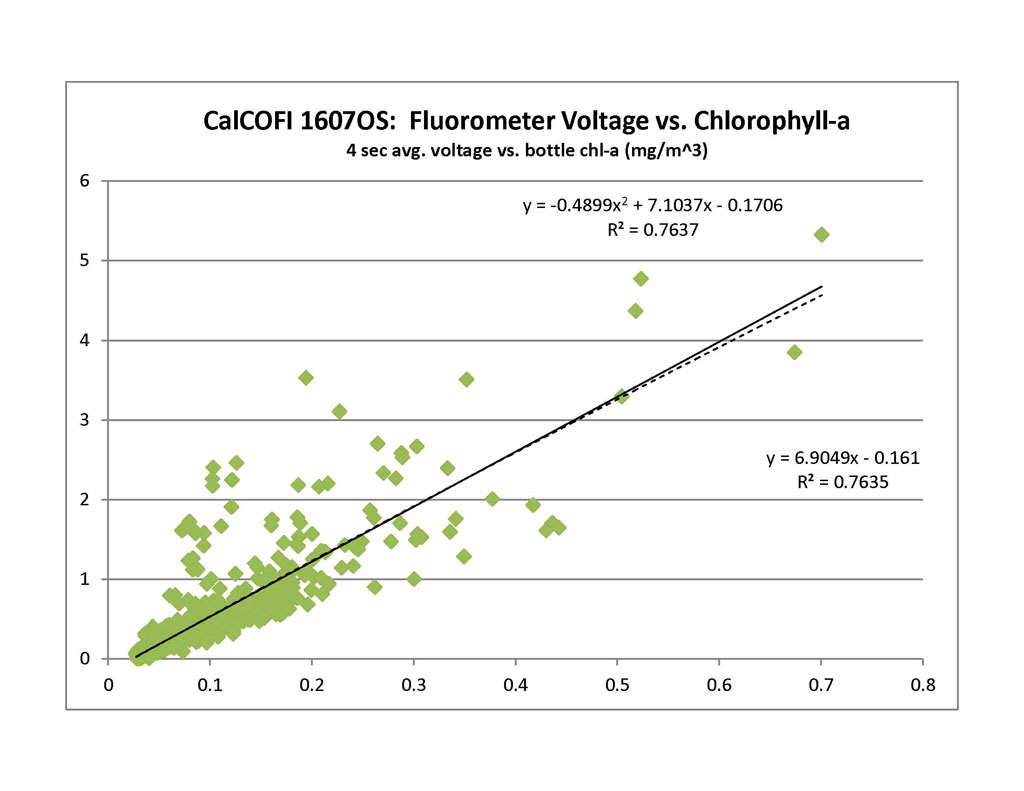
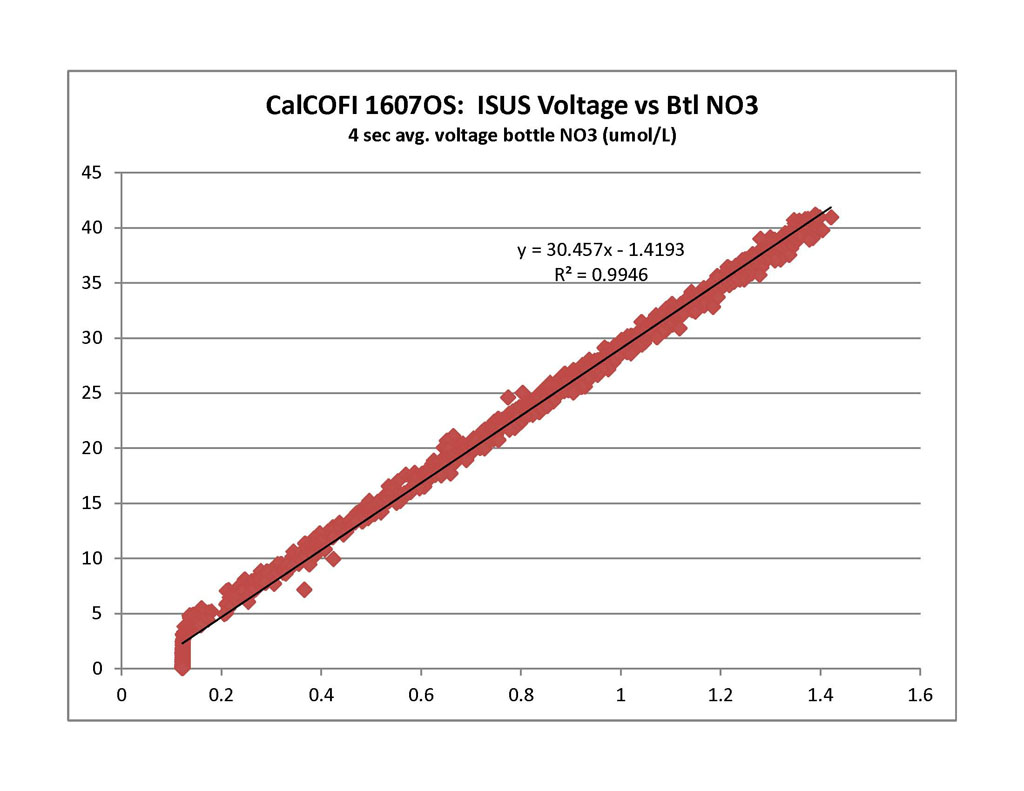
Single Nitrate (Satlantic ISUS v3 SN111) and Fluorescence (Wetlabs ECO AFL/FL) Sensors
LINEAR
POLYNOMIAL
Nitrate
y = 30.457x - 1.4193;
R² = 0.9946
Fluorescence
y = 6.9049x - 0.161;
R² = 0.7635
y = -0.4899x2 + 7.1037x - 0.1706;
R² = 0.7637
Regressions:
Please note: these regressions are generated from preliminary CTD vs bottle data and will be reprocessed once final bottle data are available. CTD temperatures and salinities do not usually change but oxygen, chlorophyll-a, and nitrate may change significantly after QAQC. Questionable or mistrip bottle data are removed from these comparisons but may be visible on the CTD.csv plots. For this cruise and future cruises, both primary & secondary sensor profiles vs bottle data will be generated and archived in the downloadable CTD+Bottle data files. These plots are under the “csv-plots\Primary” & “csv-plots\Secondary” subdirectories.