1609SR
Cruise Summary
Cruise Dates:
30 Sep – 02 Oct 2016 (Fri-Sun; 3 DAS); RV Sally Ride Shake-down cruise
Ship:
Contacts:
James R. Wilkinson, Chief Scientist
Jennifer Rodgers-Wolgast, Alternate Point-of-Contact
Station Data Collected:
CTD Sensors:
- Temperature
- Conductivity/Salinity
- Dissolved Oxygen
- Fluorescence
- Transmittance
- PAR (Photosynthetically Active Radiation)
- Nitrate (ISUS)
- Altimetry
Bottle Samples:
- Salinity
- Dissolved Oxygen
- Nutrients
- Chlorophyll-a & Phaeopigments
- Primary Productivity
- Phytoplankton
- HPLC (High Performance Liquid Chromatography)
- DIC (Dissolved Inorganic Carbon)
- NCOG DNA/RNA
Nets:
- Bongo
- Manta
- Pairovet
- PRPOOS
Underway Data Collected:
- Surface & Meteorological Measurements
- Marine Mammal Visual & Acoustic Observations
- Seabird Visual Observations
- CUFES (Continuous Underway Fish Egg Sampler)
- ADCP (Acoustic Doppler Current Profiler)
- pCO2 (partial pressure of carbon dioxide)
- ALF (Advanced Laser Fluorometer)
- Fisheries Acoustic Observations (EK60)
CTD Processing Notes
CTD Sensor Corrections:
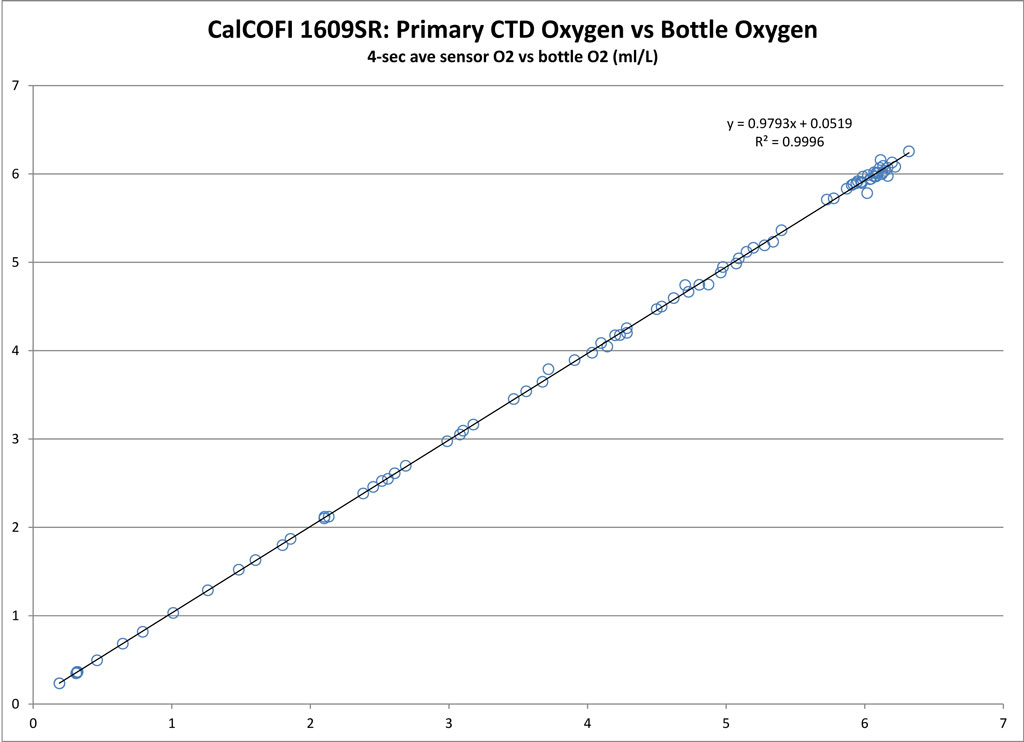
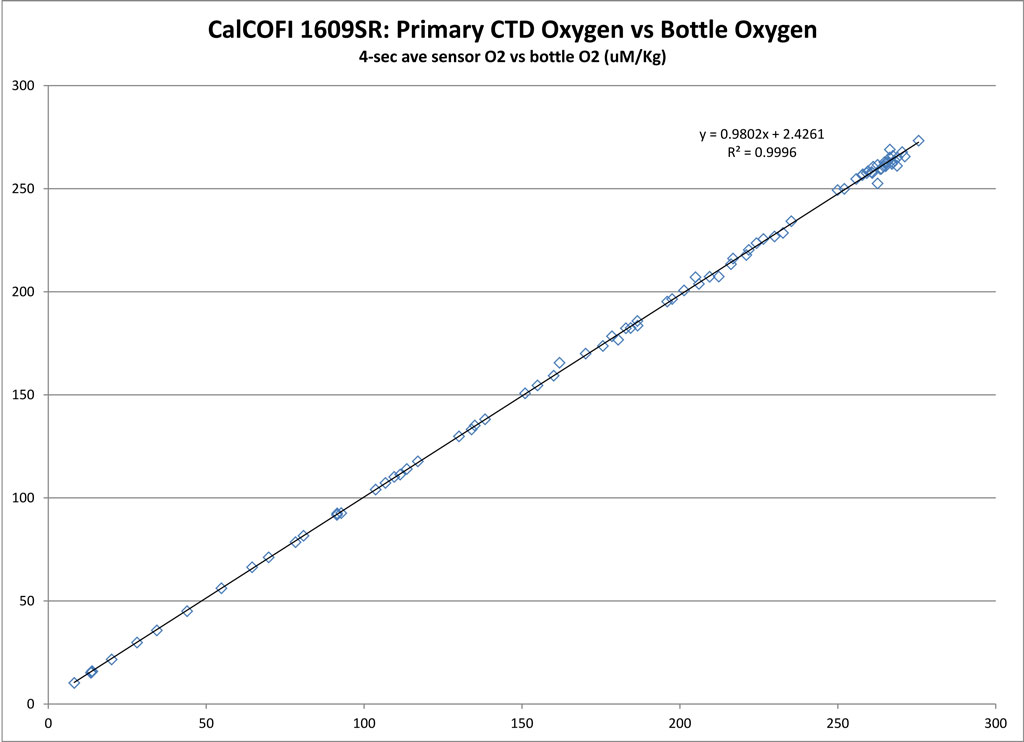
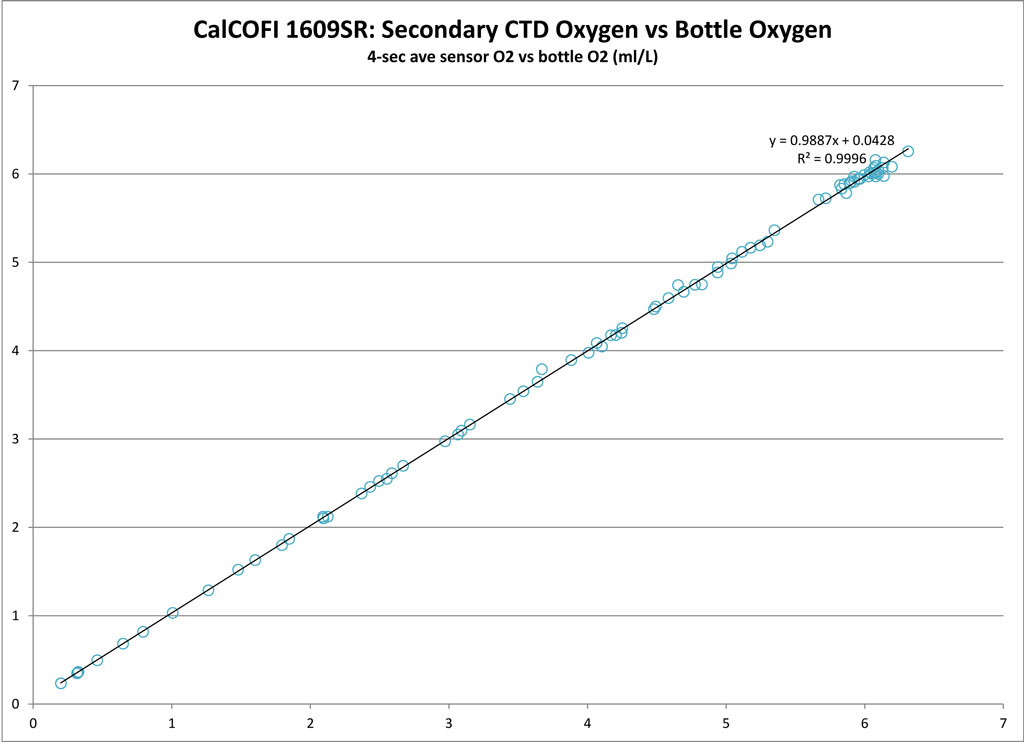
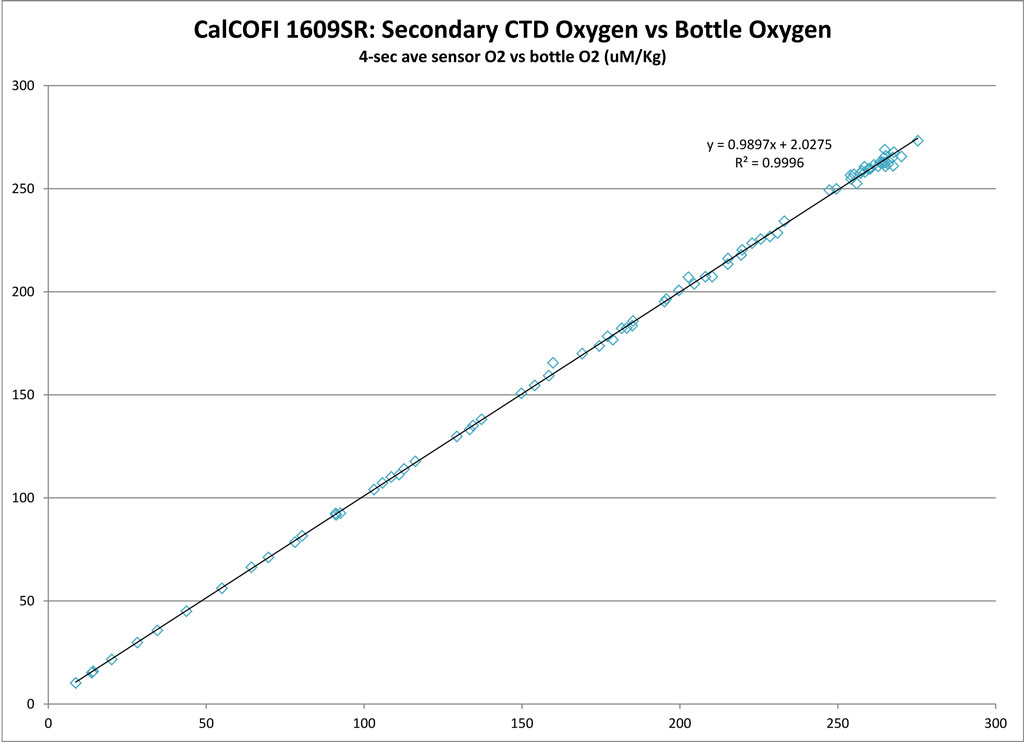
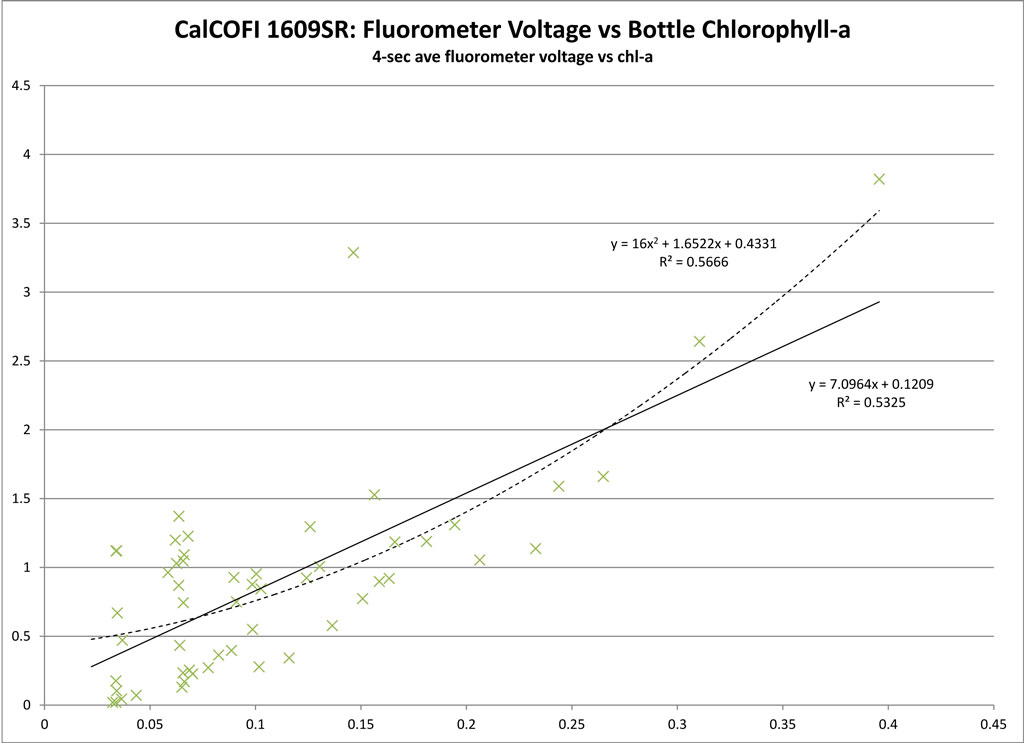
Derived by comparing sensor data (4 sec avg prior-to-bottle closure) to bottle samples.
Dual Salinity (Seabird SBE4) and Oxygen (Seabird SBE43) Sensors
| PRIMARY SENSOR | SECONDARY SENSOR | |
|---|---|---|
| Salinity offset (bottle - sensor; > 350 m) | 0.0009 | -0.0028 |
| Oxygen ml/L | y = 0.9793x + 0.0519; R² = 0.9996 | y = 0.9887x + 0.0428; R² = 0.9996 |
| Oxygen umol/Kg | y = 0.9802x + 2.4261; R² = 0.9996 | = 0.9897x + 2.0275; R² = 0.9996 |
Single Nitrate (Satlantic ISUS v3 SN111) and Fluorescence (Wetlabs ECO AFL/FL) Sensors
| LINEAR | POLYNOMIAL | |
|---|---|---|
| Nitrate | Not deployed | |
| Fluorescence | y = 7.0964x + 0.1209; R² = 0.5325 | y = 16x² + 1.6522x + 0.4331; R² = 0.5666 |
Regressions:
Please note: these regressions are generated from preliminary CTD vs bottle data and will be reprocessed once final bottle data are available. CTD temperatures and salinities do not usually change but oxygen, chlorophyll-a, and nitrate may change significantly after QAQC. Questionable or mistrip bottle data are removed from these comparisons but may be visible on the CTD.csv plots. For this cruise and future cruises, both primary & secondary sensor profiles vs bottle data will be generated and archived in the downloadable CTD+Bottle data files. These plots are under the “csv-plots\Primary” & “csv-plots\Secondary” subdirectories.
General Notes
CalCOFI 1609SR/SR1606 RV Sally Ride Science Verification Cruise
CalCOFI 1609SR was a test cruise occupying 9 coastal stations. Unfortunately, naval operations west of sta 93.28 stopped us from heading further offshore as originally scheduled. After 93.28, we headed north and worked our way out to Catalina Island. We did a 24 bottle 1160m cast on 90.37. All other stations were 12 bottles or less so check samples were minimal. At least 50% of the bottle samples were analyzed after we returned to SIO. Chlorophylls from the second day were not run until 2 days after returning so may be questionable.
All data from the CTD sensors are good but the RV Sally Ride deck unit conductivity offset was misconfigured. Primary & secondary conductivity were offset 0.73 seconds instead of the proper 0.073 seconds. So a -0.657 offset to conductivity was applied in post-processing using AlignCTD. Additionally, there were very few deep salts (deeper than 340m) to calculate an offset and correct the primary & secondary salinities. Oxygens had more samples and the regression comparisons look pretty good.
Temperature, salinity, and oxygen data from this cruise are useful but will not be added to the CalCOFI database. If we had been able to occupy more stations offshore, then we would consider adding them as ancillary data. They are reported here as an archive of the science verification cruise.
The CTD temperature, conductivity, and oxygen sensors were freshly calibrated or deployed for the first time after calibration months earlier. There did not appear to be any issue with the sensors except the misconfiguration of the deck unit causing spikes in the salinity profiles during the cast.
Please note that net tows were performed but samples were not saved. There are no associated zooplankton samples to compare to the hydrographic data. This was a test cruise prelude to November 1611SR CalCOFI.
An 88m CTD cast (1609002) at Sta 93.4 27.0 was ~100yd SE of Uwe Send’s Del Mar Mooring. These data may be used for comparison to the mooring data.
A final version of these data is not planned since there will be no point-checking or data quality assessment beyond basic error-checking.
Please note that these regressions are generated from preliminary CTD vs bottle data and will NOT be reprocessed since final bottle data will not be processed. This was a test cruise and minimal bottle samples were collected. CTD sensor data are good and have been processed normally. Both primary & secondary sensor profiles vs bottle data have been generated and archived in the downloadable CTD+Bottle data files. These plots are under the “csv-plots\Primary” & “csv-plot\Secondary” subdirectories. Please note: if re-processing the CTD raw cast data, the RV Sally Ride deck unit used was misconfigured, offsetting the primary and secondary conductivity 0.73sec instead of 0.073sec. An offset of -0.657sec should be applied using AlignCTD to calculate salinity correctly. These will not be imported into the CalCOFI database or processed into final form. They are provided as an archive.

