CalCOFI 1711SR sailed from Nimitz Marine Facilities (MarFac), San Diego at 0800 09 Nov 2017 with 17 scientists, technicians, & volunteers. 74 of 75 scheduled stations were successfully occupied; one station was missed due to naval operations precluding our timely occupation of sta 90.45. A personnel exchange mid-cruise caused a major change in the station order. On Line 80, sta 80.55, we were restricted from station due to a NOAA weather satellite missle launch so we continued west to 80.60. Sta 80.55 was occupied on our southward transit to Line 87. Refer to cruise track map for actual cruise track and station order. RV Sally Ride returned to San Diego at ~1430 24 Nov 2017 & due to the Thanksgiving holiday, offloading was postponed till 0800 Monday 27 Nov.
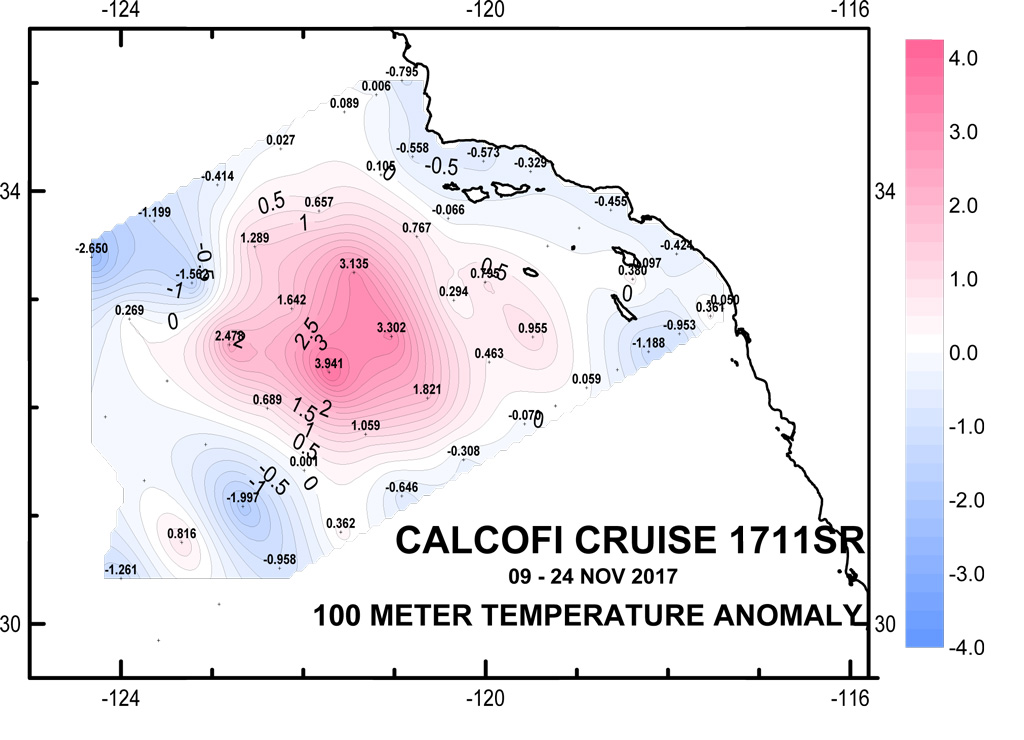
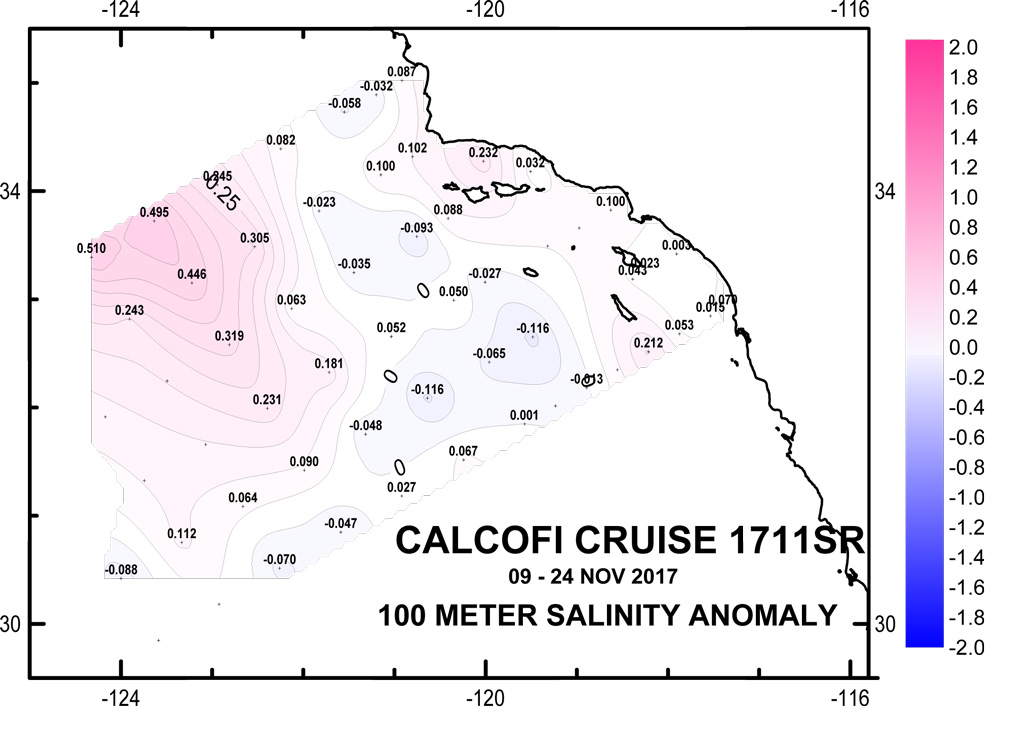
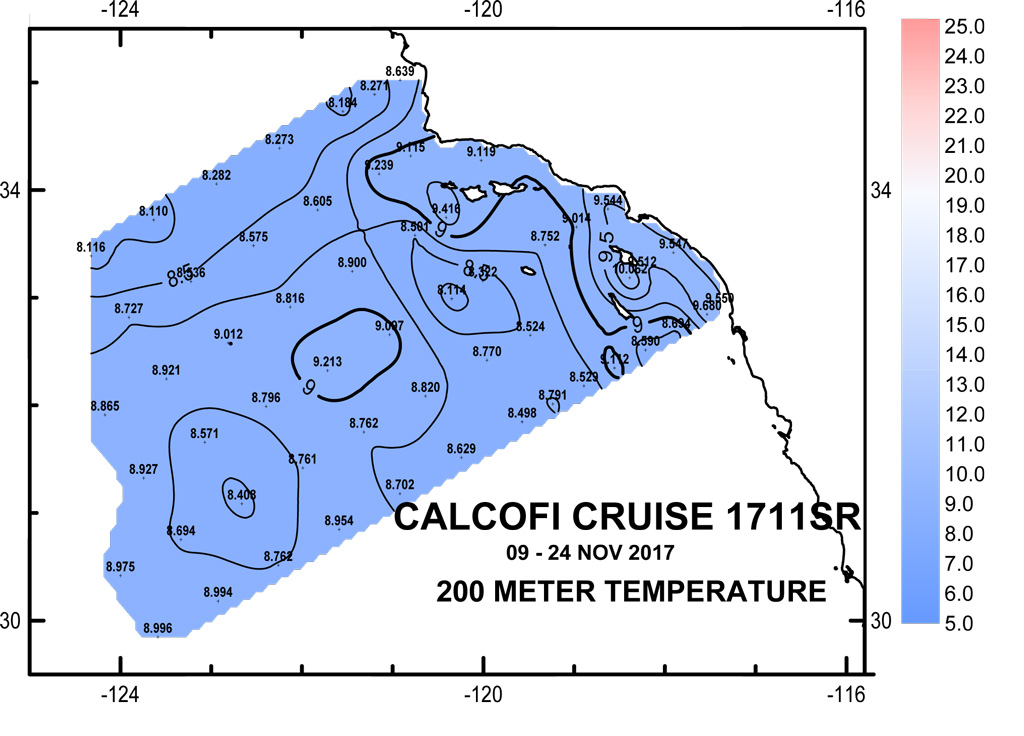
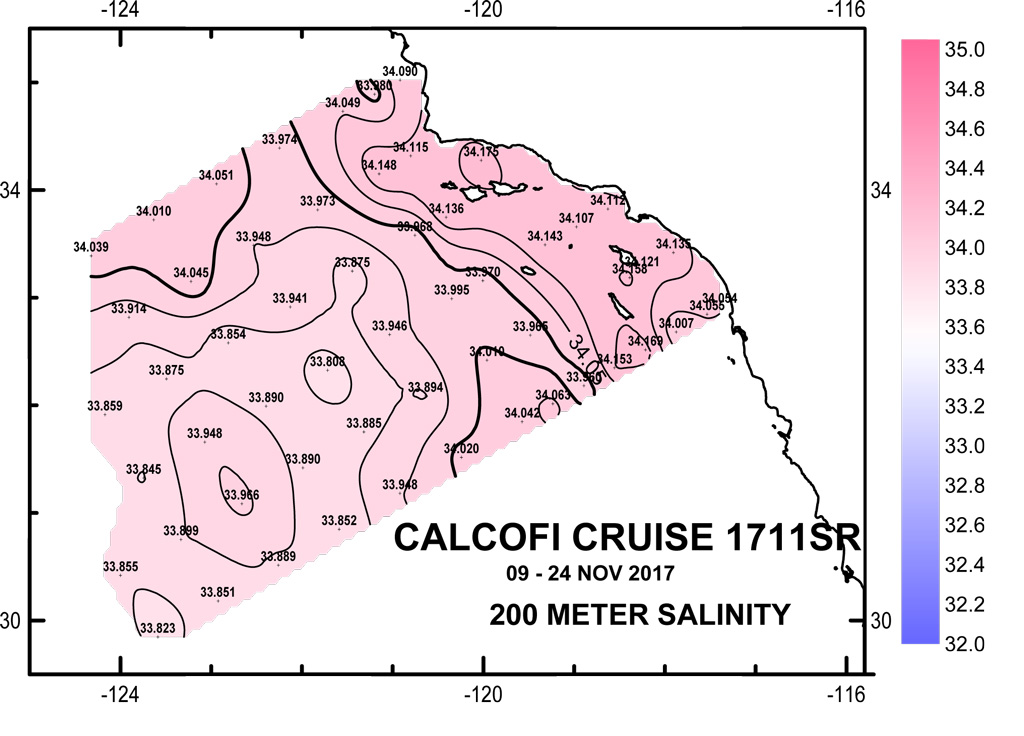
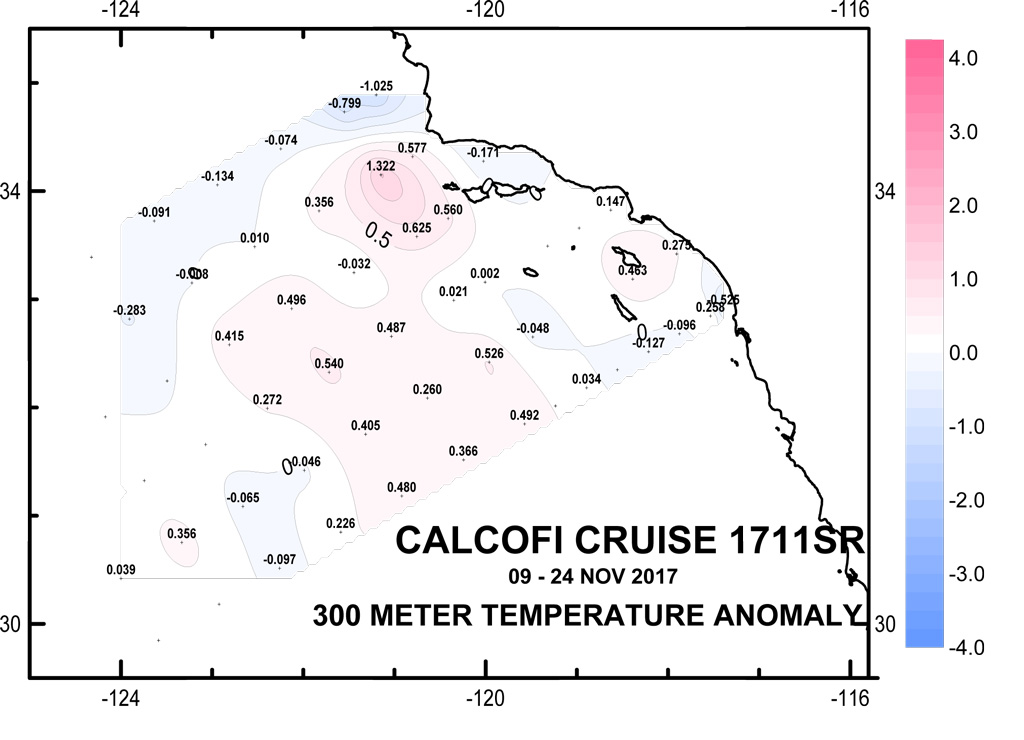
Please note: these data are 1m-bin-average Seasoft-processed CTD data that have not gone through quality control checks or bottle corrections. Anomalies are based on 50-year harmonics (1949-1999).
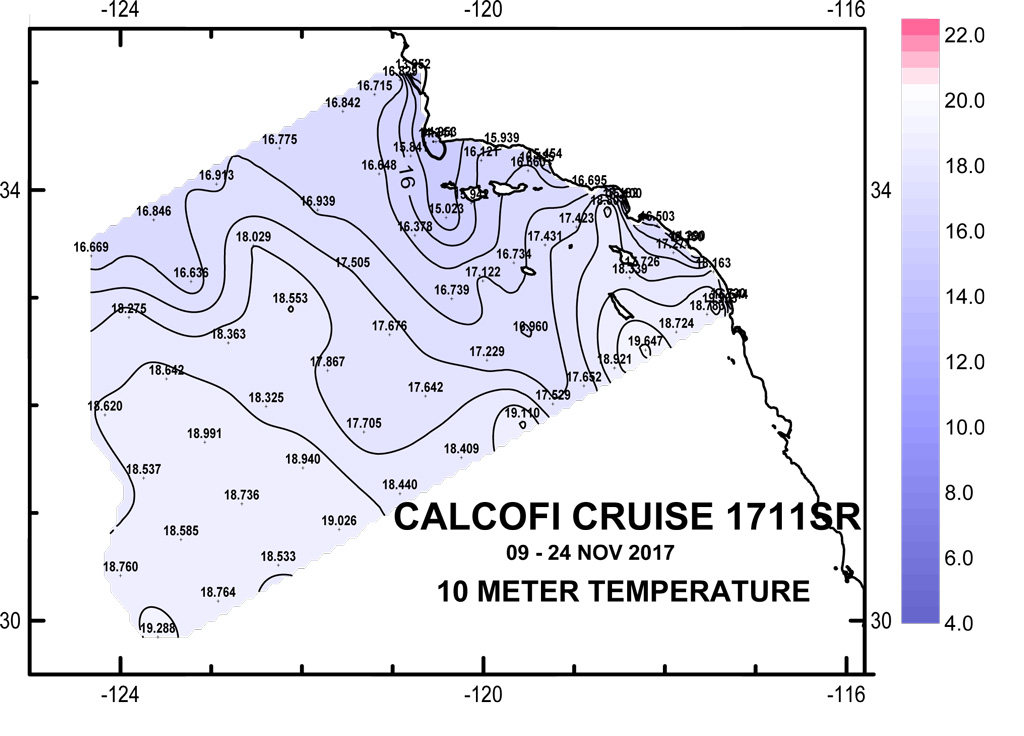
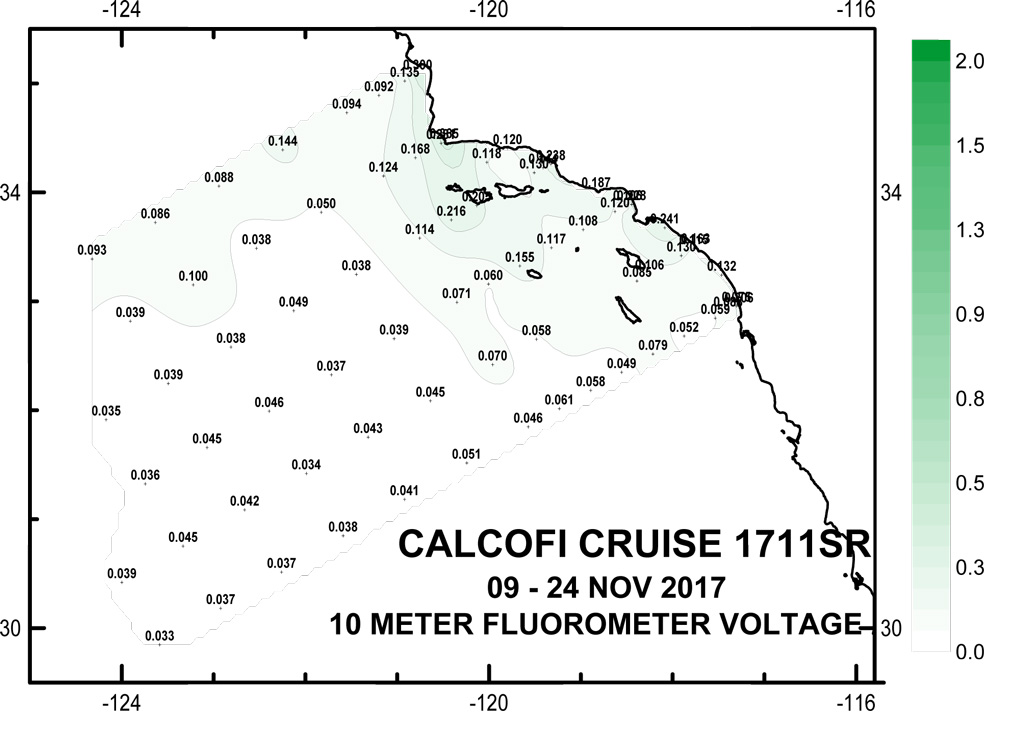
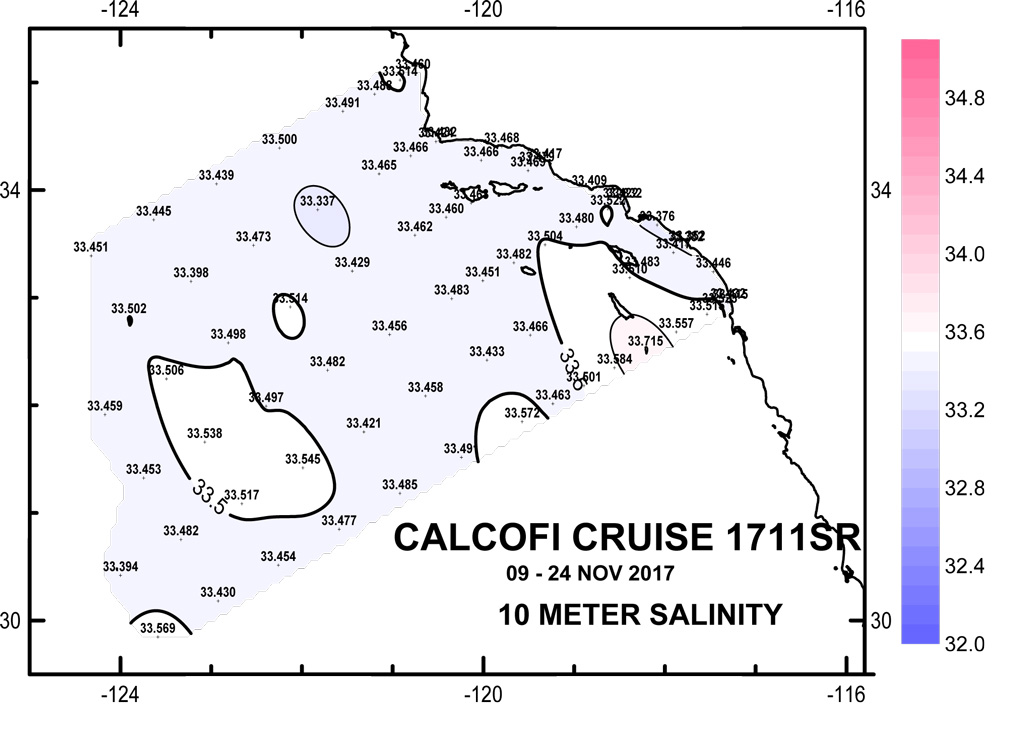
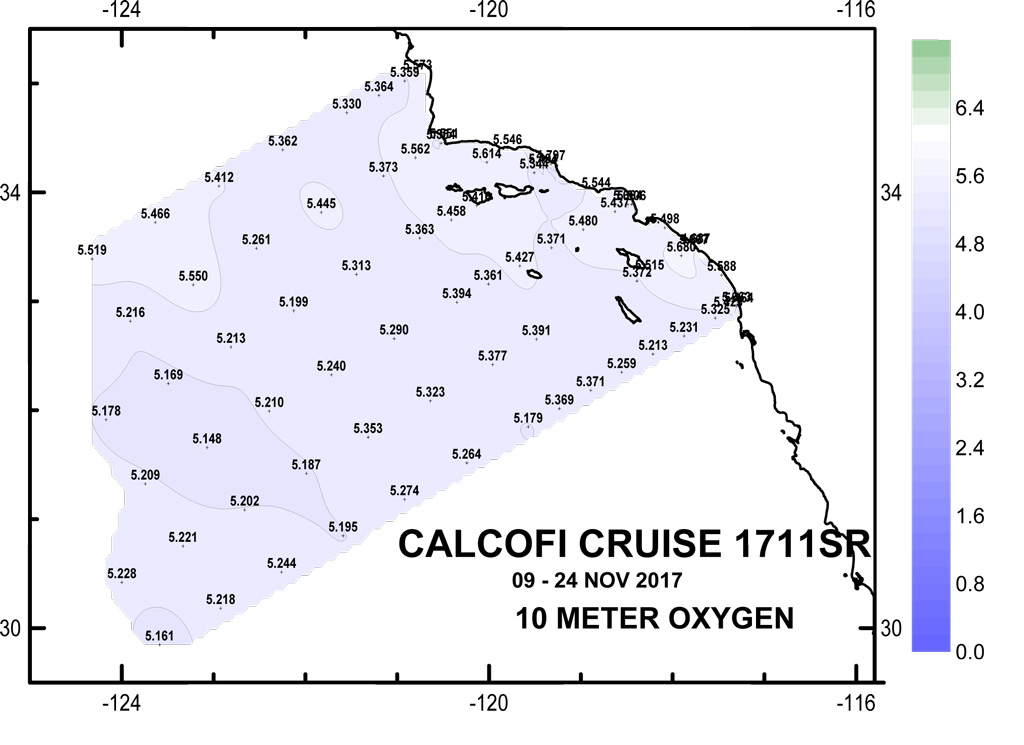
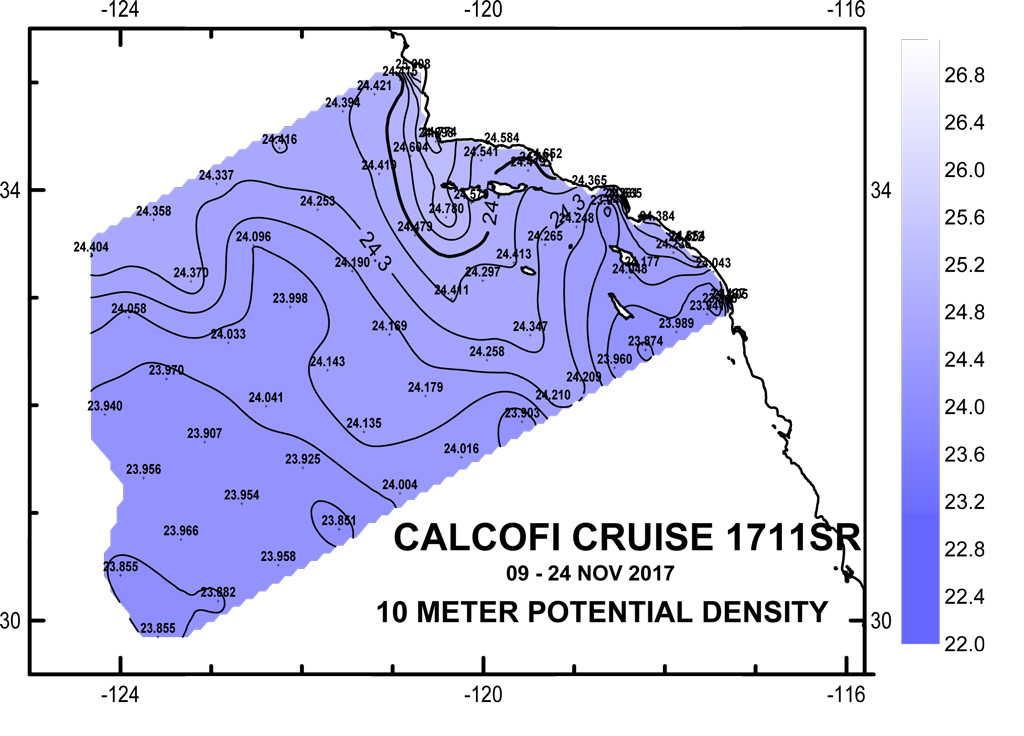
10 meter Preliminary CTD Data Contours
(Click for larger image)
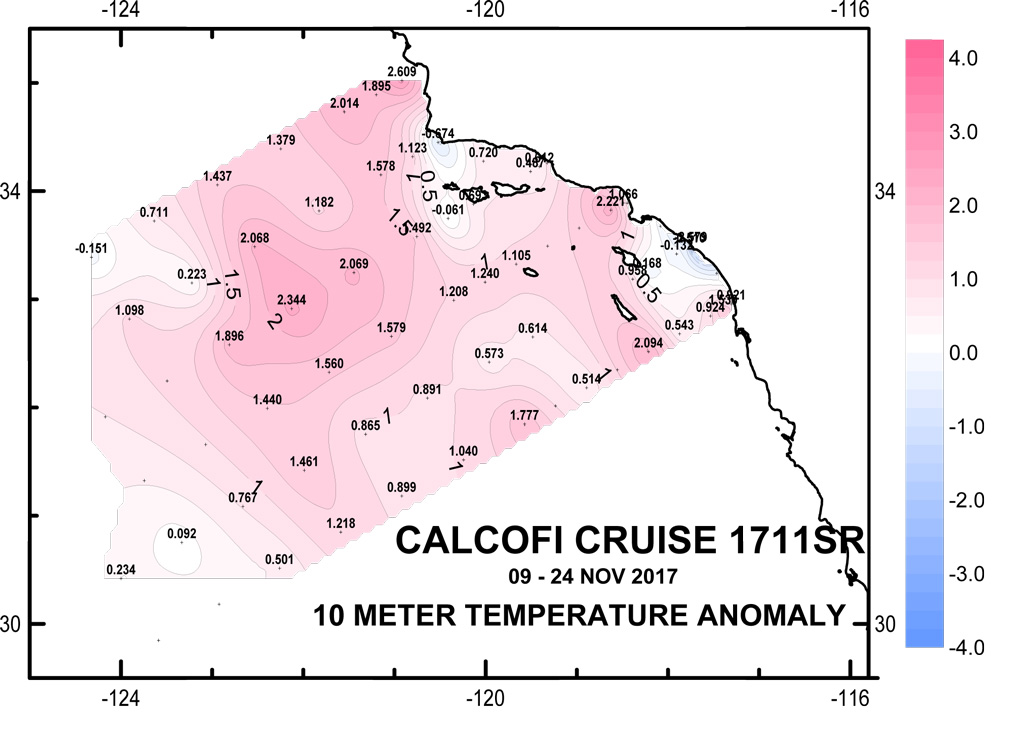
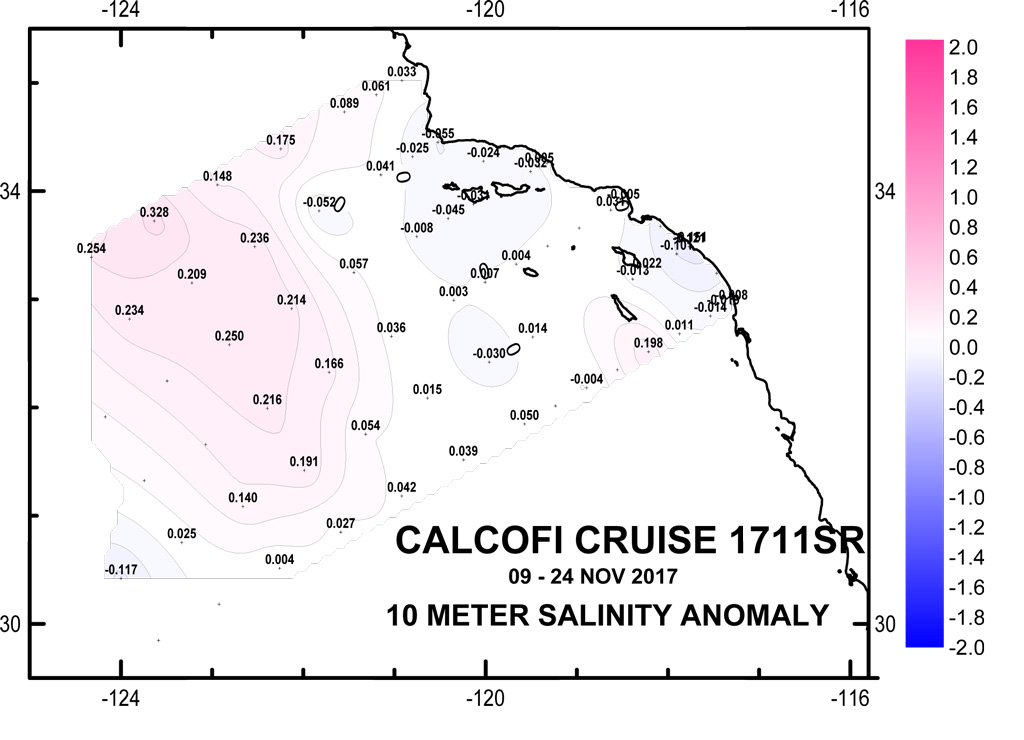
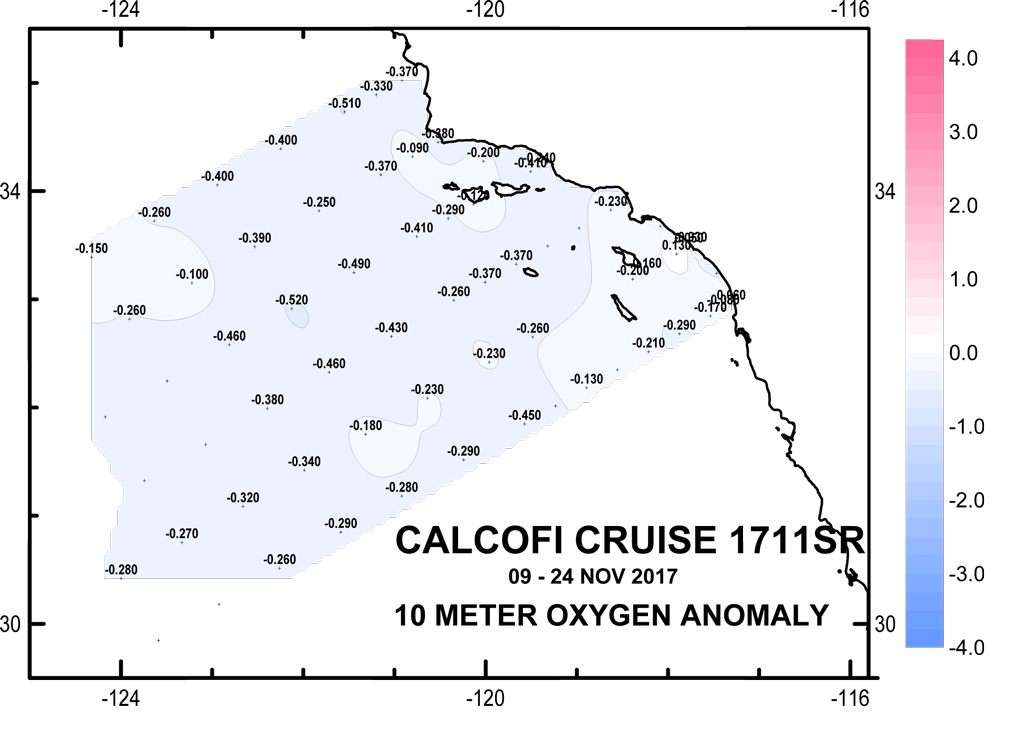
10 meter Anomaly Contours (50 yr mean)
(Click for larger image)
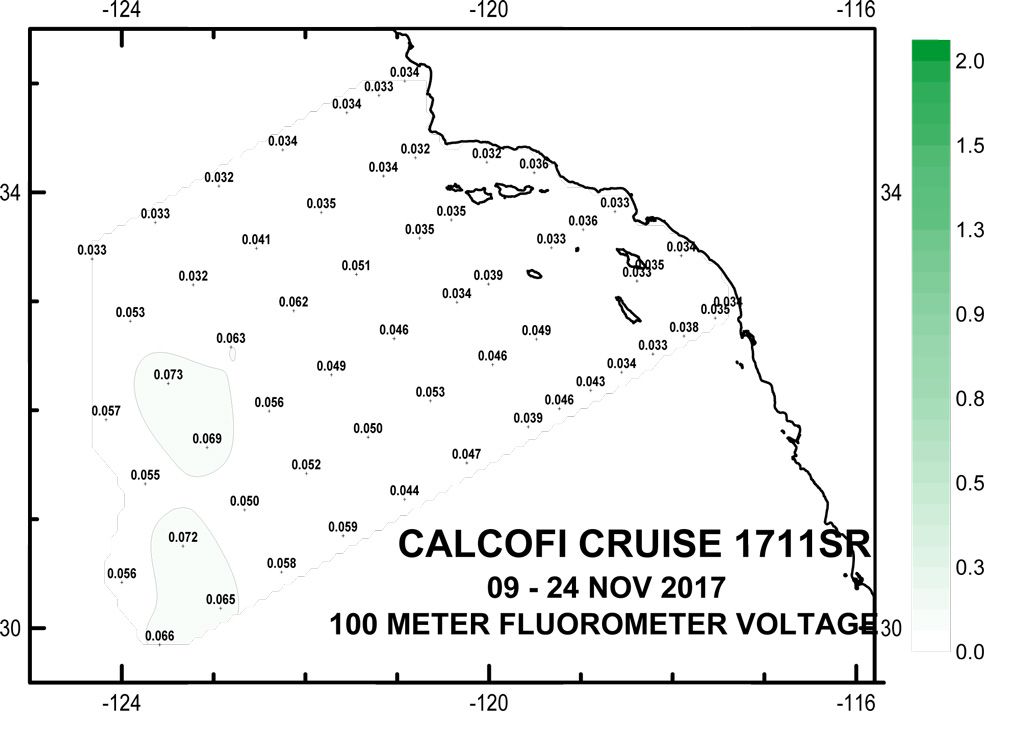
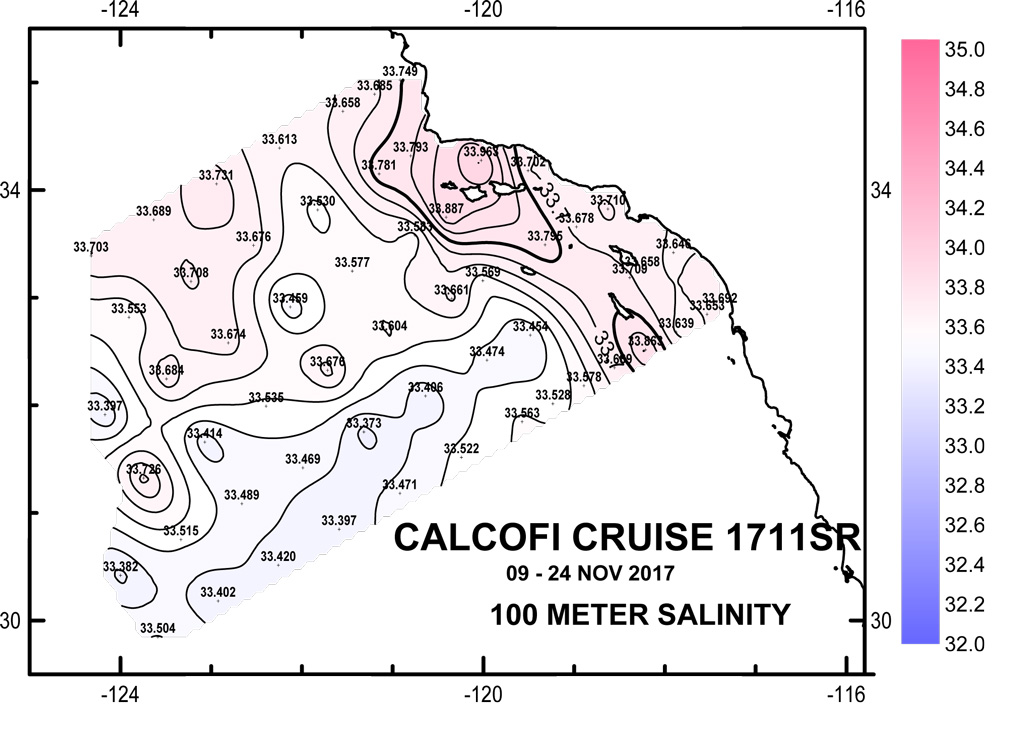
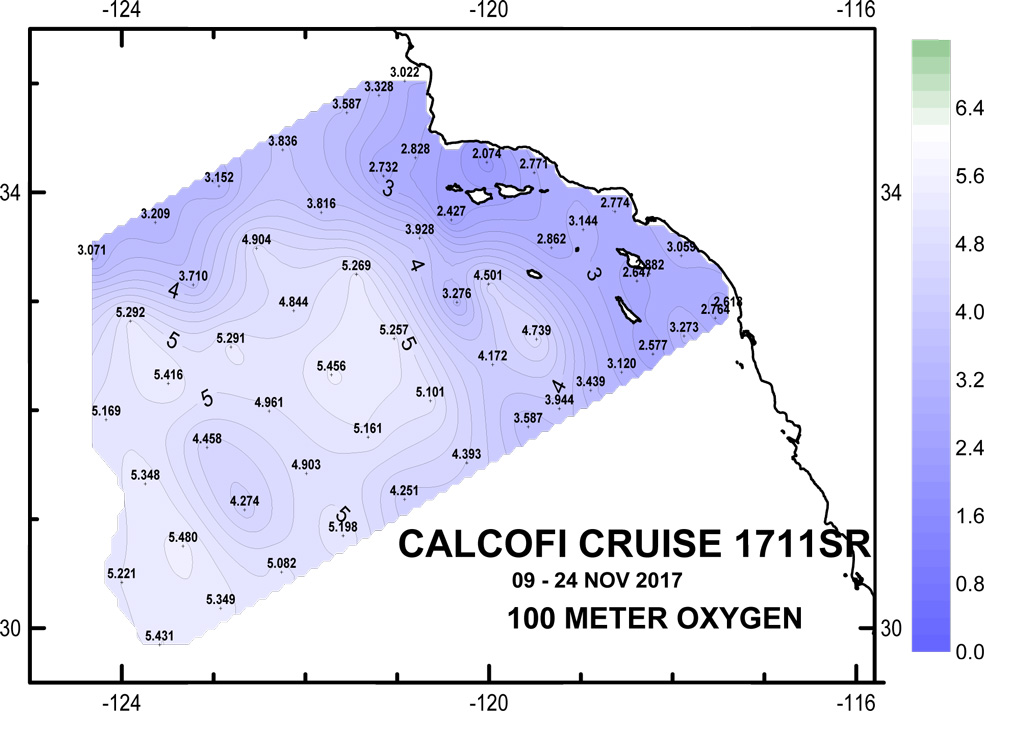
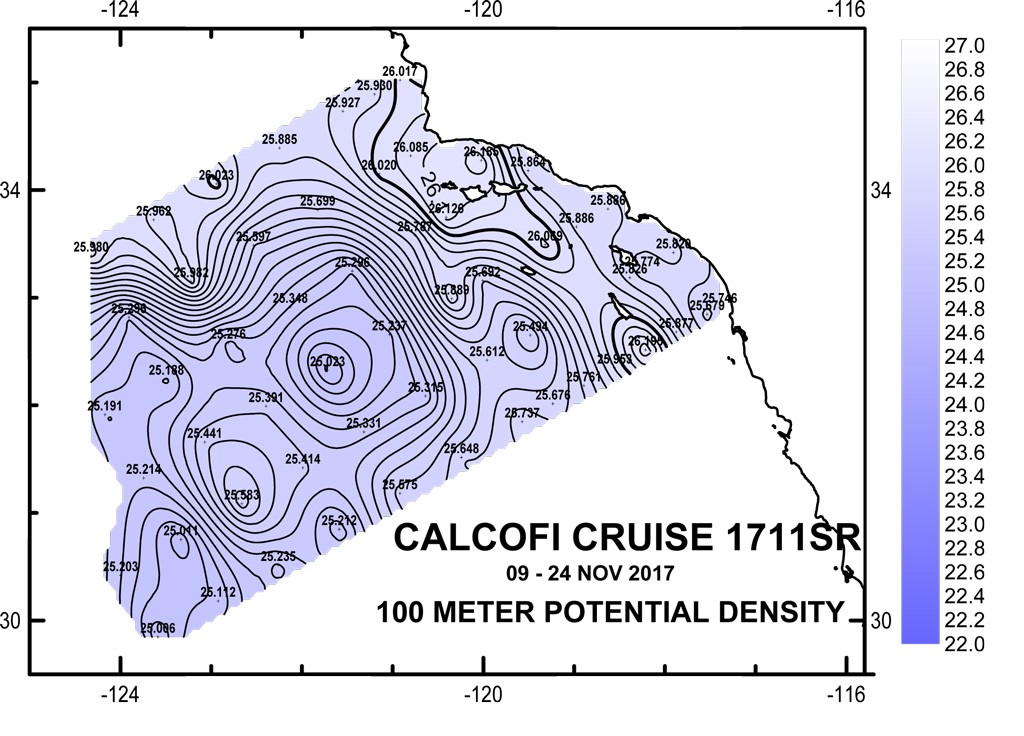
100 meter Preliminary CTD Data Contours
(Click for larger image)
100 meter Anomaly Contours (50 yr mean)
(Click for larger image)
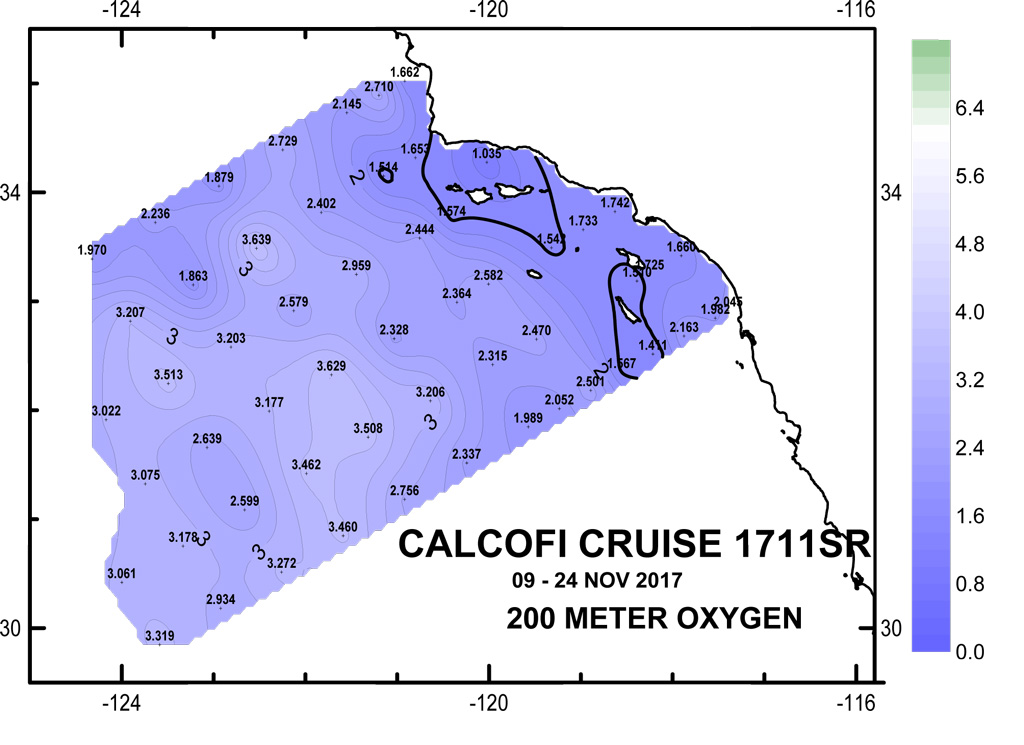
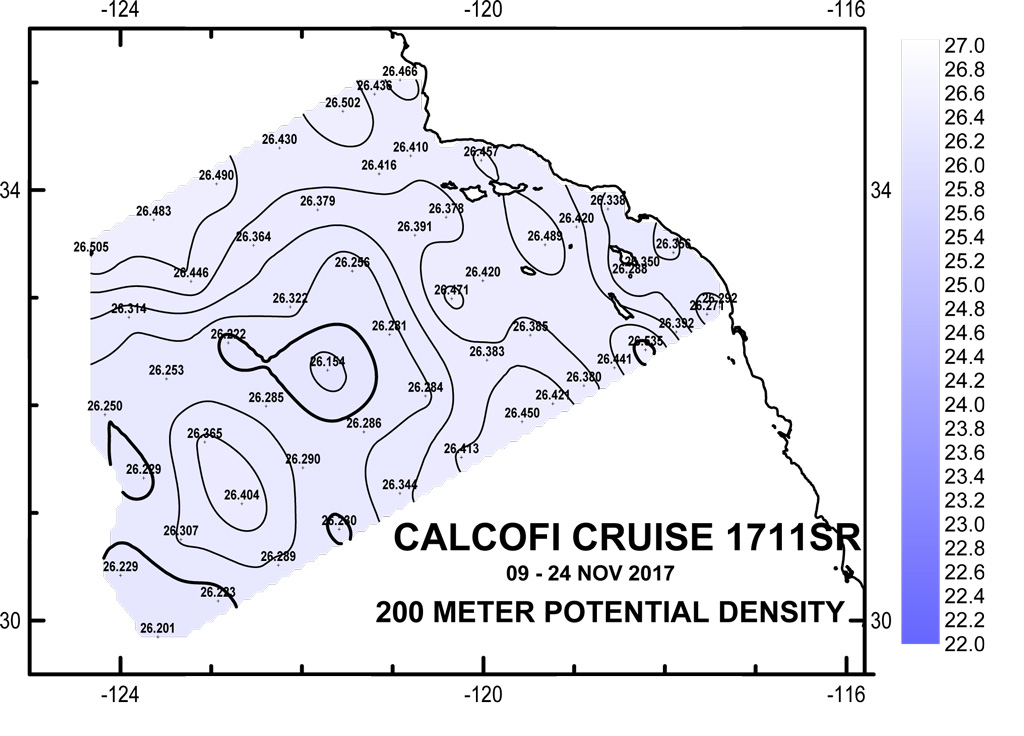
200 meter Preliminary CTD Data Contours
(Click for larger image)
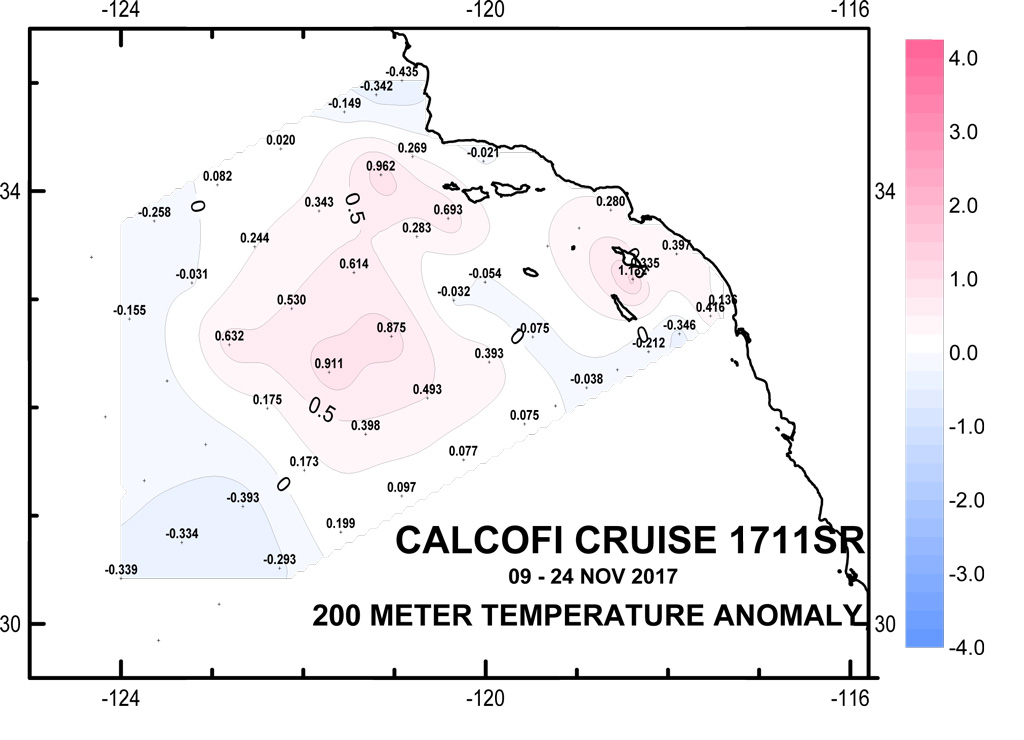
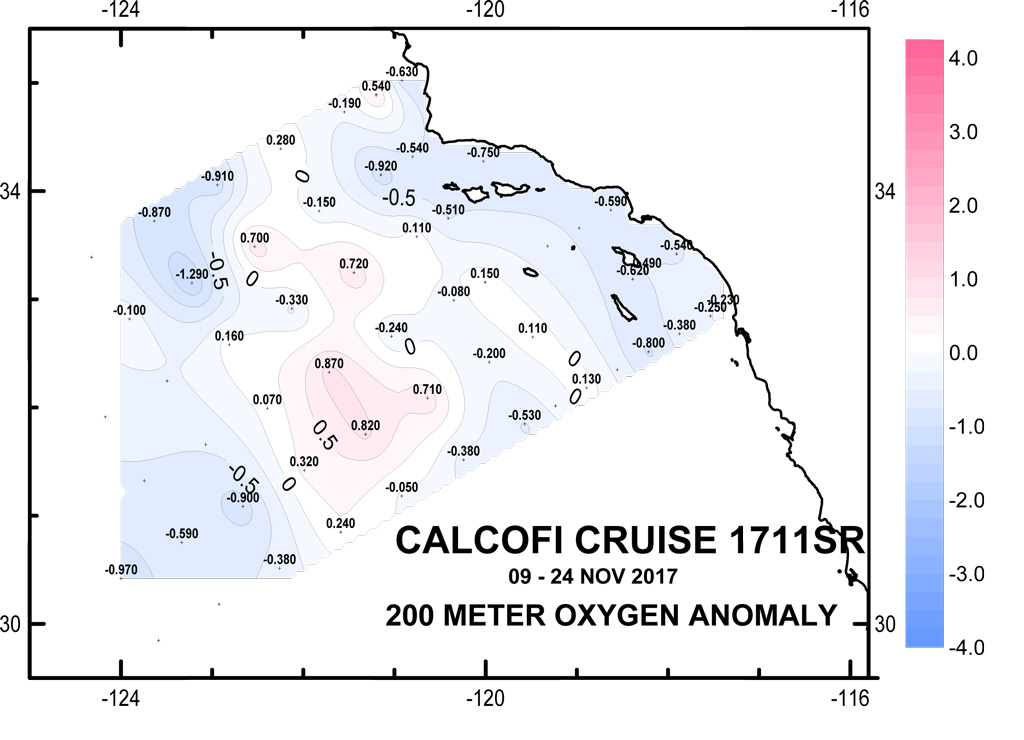
200 meter Anomaly Contours (50 yr mean)
(Click for larger image)
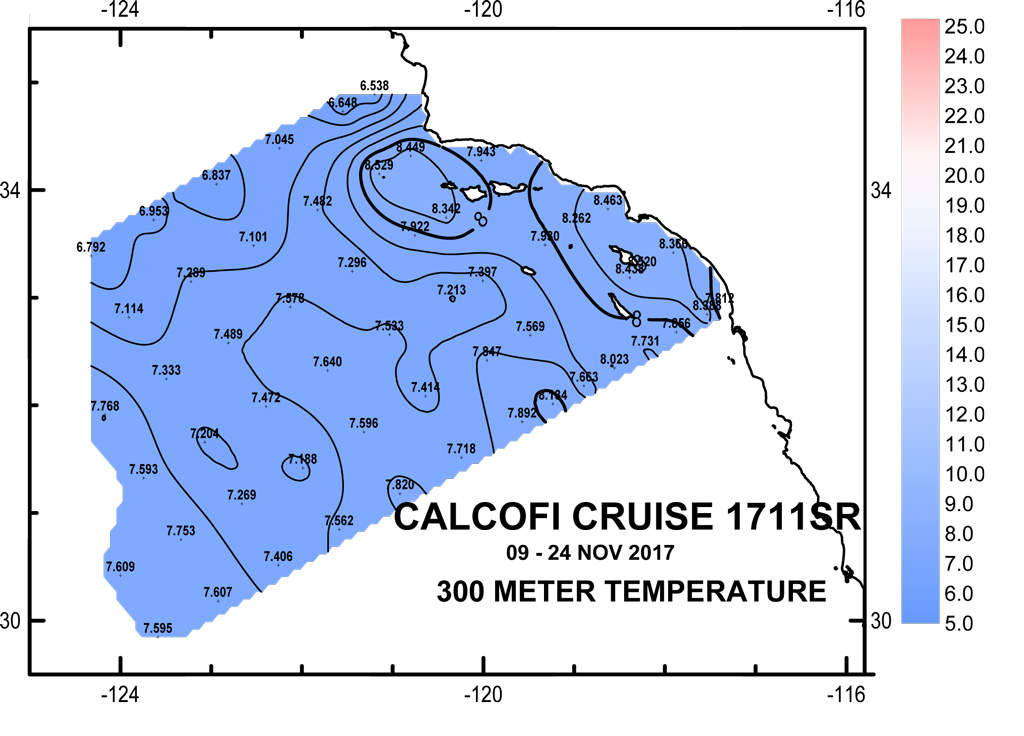
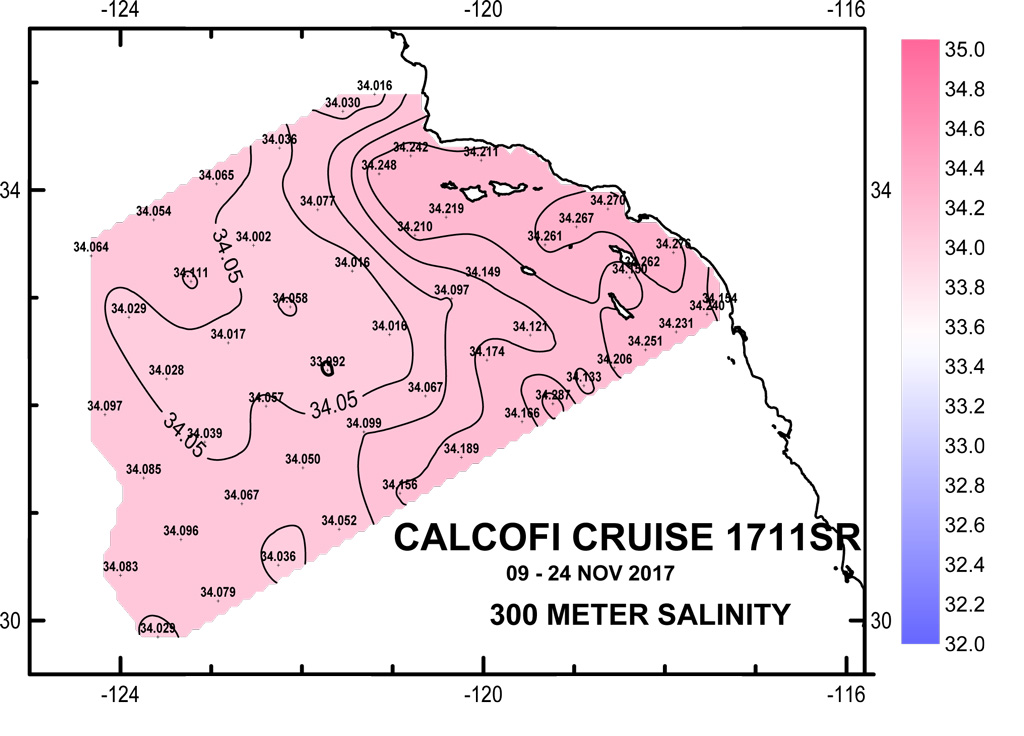
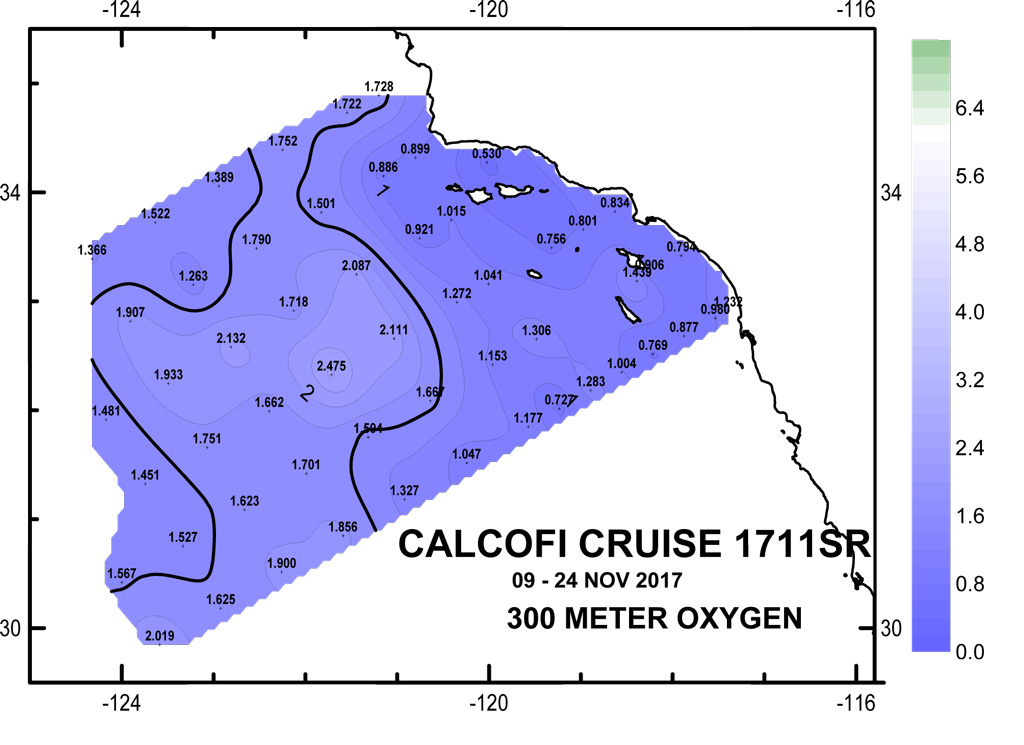
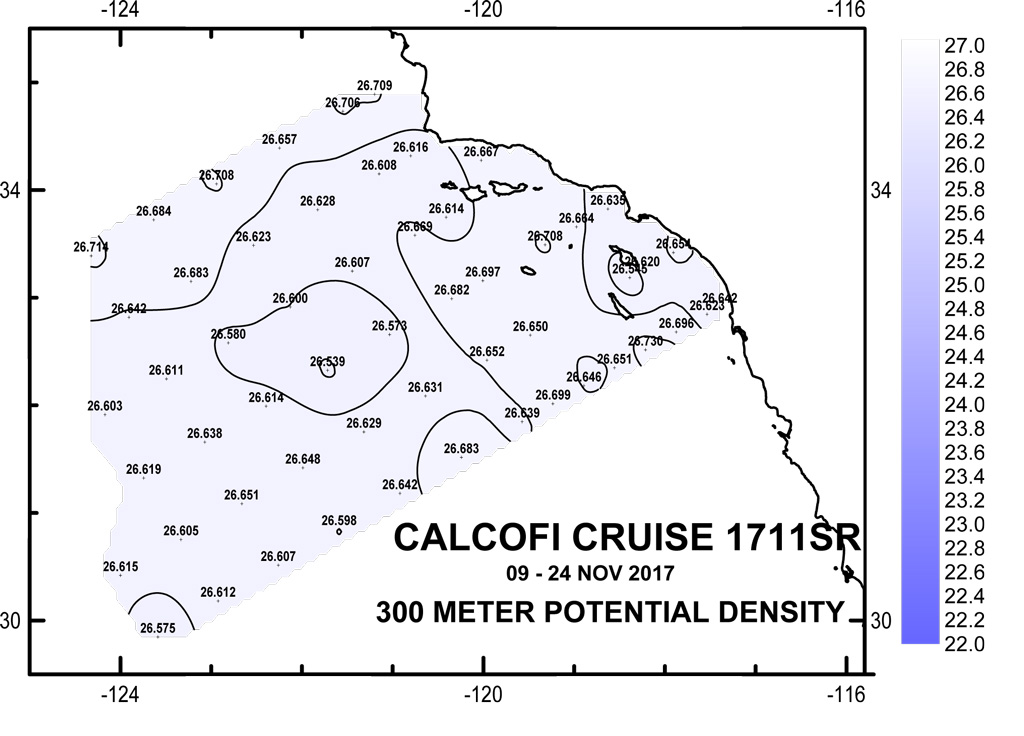
300 meter Preliminary CTD Data Contours
(Click for larger image)
300 meter Anomaly Contours (50 yr mean)
(Click for larger image)
CTD Processing Notes
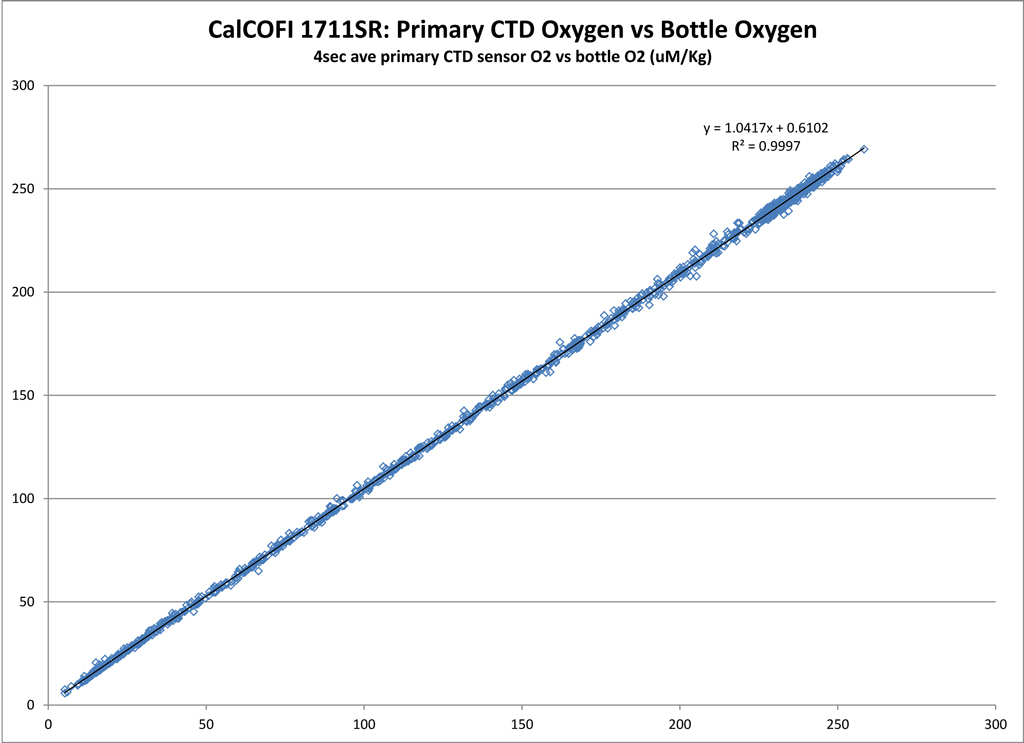
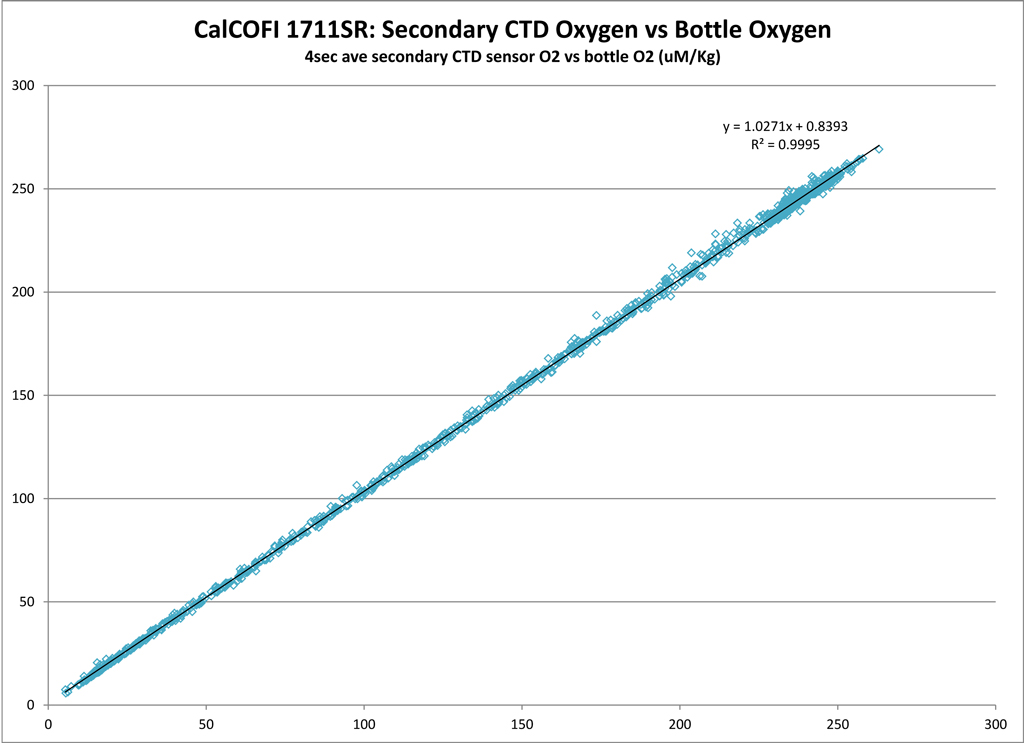
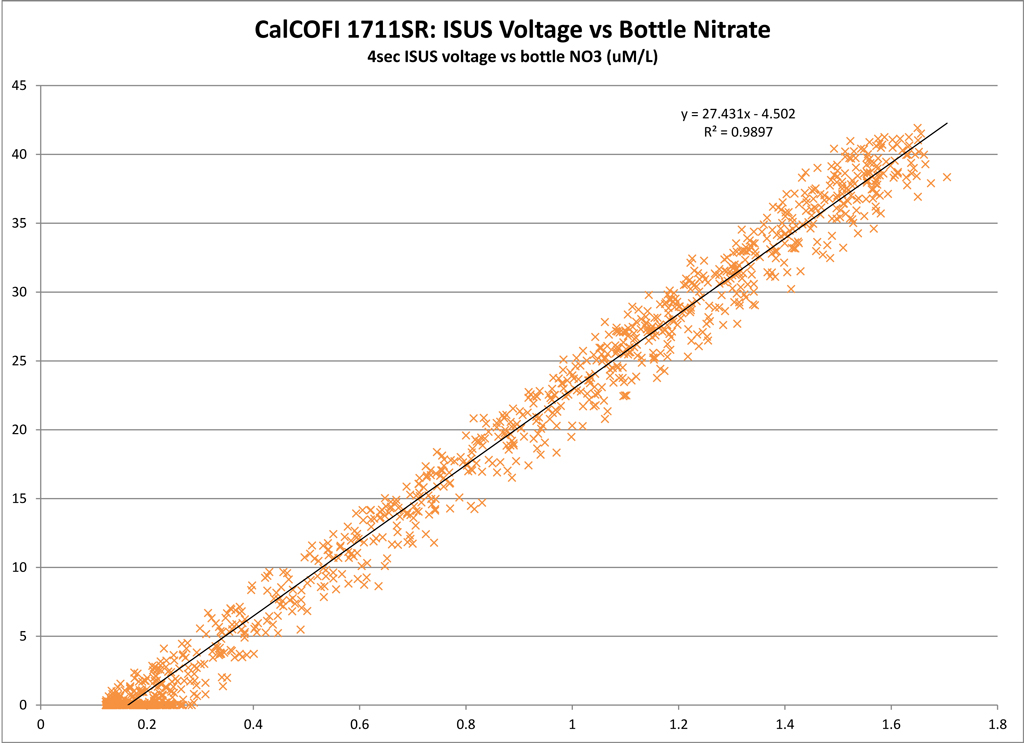
CTD Sensor Corrections:
Derived by comparing sensor data (4 sec avg prior-to-bottle closure) to bottle samples.
Dual Salinity (Seabird SBE4) and Oxygen (Seabird SBE43) Sensors
PRIMARY SENSOR
SECONDARY SENSOR
Salinity offset (bottle - sensor; > 350 m)
-0.0004
-0.0024
Oxygen ml/L
y = 1.0403x + 0.0123;
R² = 0.9997
y = 1.0257x + 0.0166;
R² = 0.9996
Oxygen umol/Kg
y =1.0417x + 0.6102;
R² = 0.9997
y = 1.0271x + 0.8393;
R² = 0.9995
Single Nitrate (Satlantic ISUS v3 SN111) and Fluorescence (Wetlabs ECO AFL/FL) Sensors
LINEAR
POLYNOMIAL
Nitrate
y = 27.431x - 4.502;
R² = 0.9897
Fluorescence
y= 9.7172x - 0.3856;
R² = 0.7541
y = 31.828x2 + 1.0443x - 0.0142;
R² = 0.8267
Regressions:
Please note: these regressions are generated from preliminary CTD vs bottle data and will be reprocessed once final bottle data are available. CTD temperatures and salinities do not usually change but oxygen, chlorophyll-a, and nitrate may change significantly after QAQC. Questionable or mistrip bottle data are removed from these comparisons but may be visible on the CTD.csv plots. For this cruise and future cruises, both primary & secondary sensor profiles vs bottle data will be generated and archived in the downloadable CTD+Bottle data files. These plots are under the “csv-plots\Primary” & “csv-plots\Secondary” subdirectories.