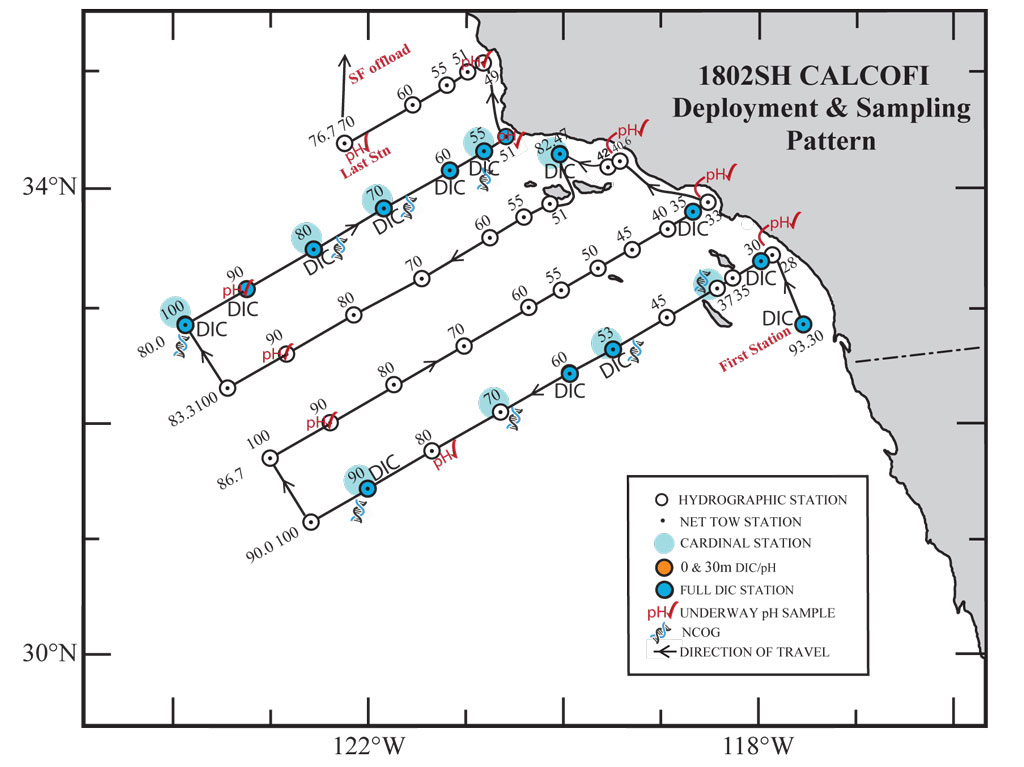
CalCOFI 1802SH sailed on NOAA Ship Bell M. Shimada on 01 Feb 2018 from 10th Avenue Marine Terminal, San Diego. With only eleven days-at-sea, 40 stations were scheduled. With mostly calm weather and fast transit times, 5 additional stations on Line 77 were added. Forty-five stations were completed before transiting north & offloading in San Francisco.
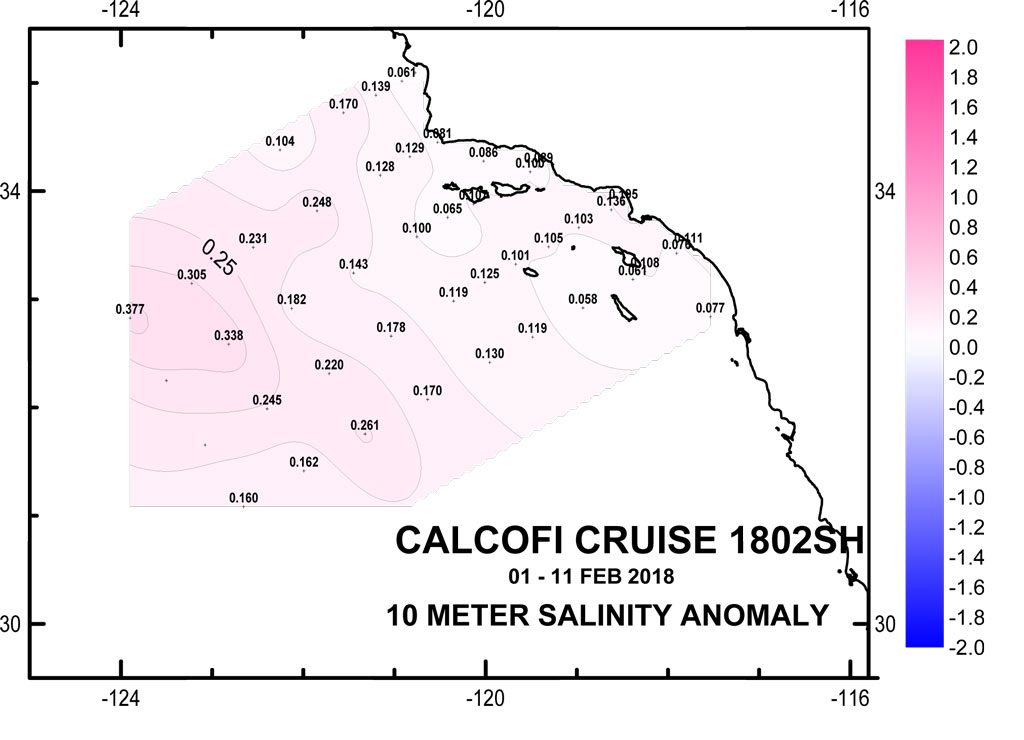
Please note: these data are 1m-bin-average Seasoft-processed CTD data that have not gone through quality control checks or bottle corrections. Anomalies are based on 50-year harmonics (1949-1999).
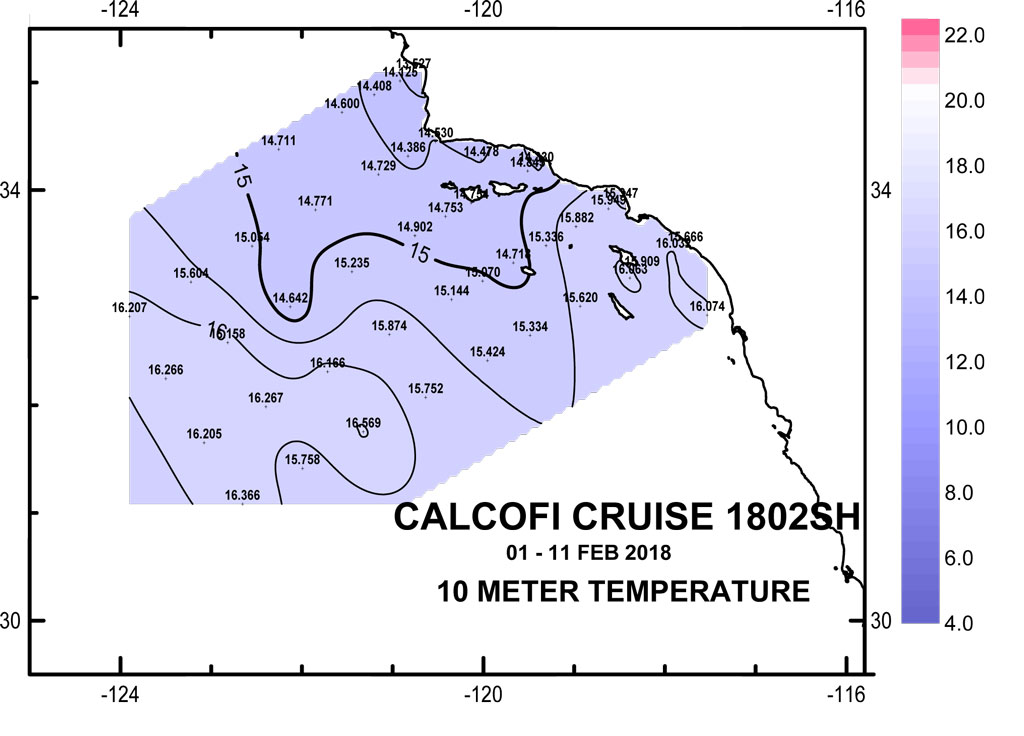
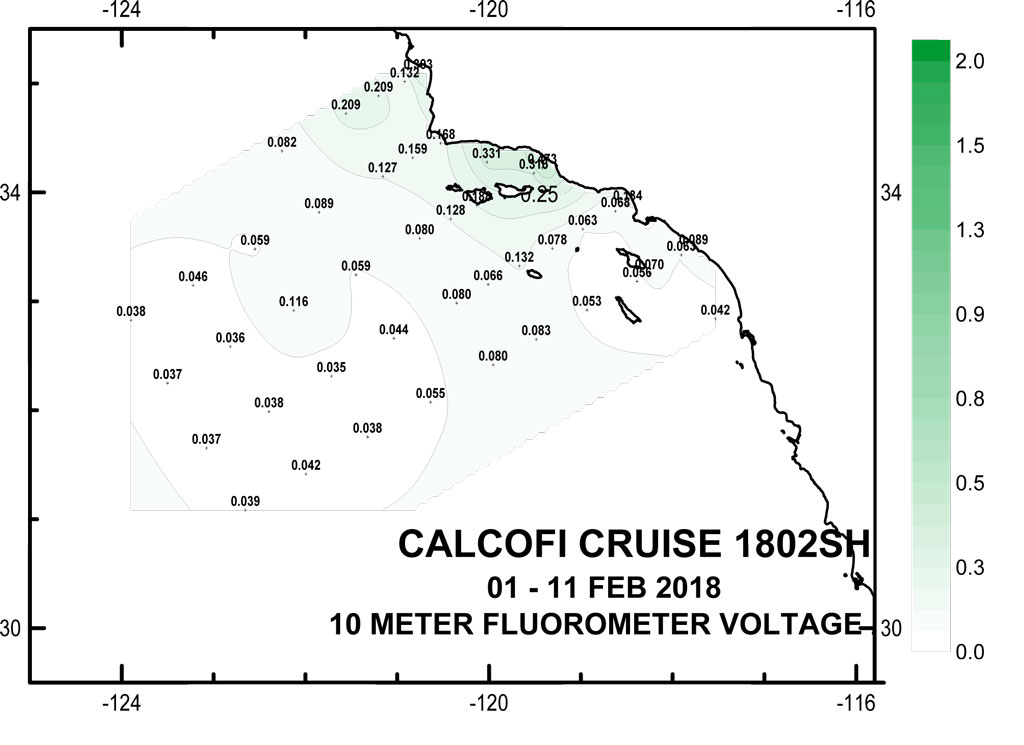
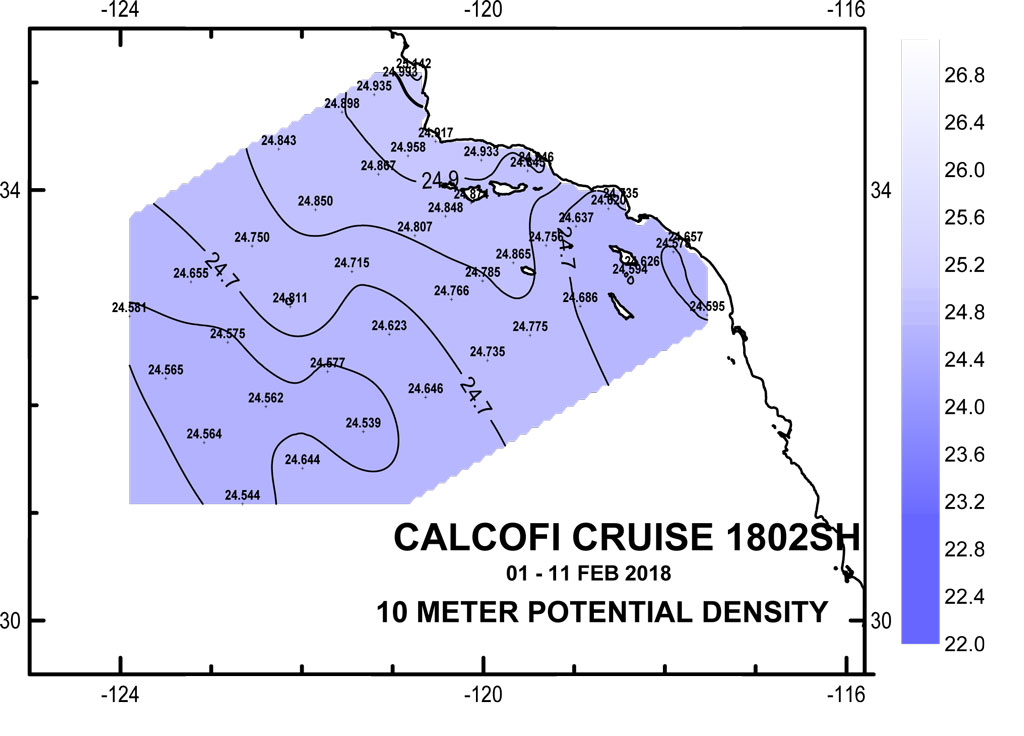
10 meter Preliminary CTD Data Contours
(Click for larger image)
10 meter Anomaly Contours (50 yr mean)
(Click for larger image)
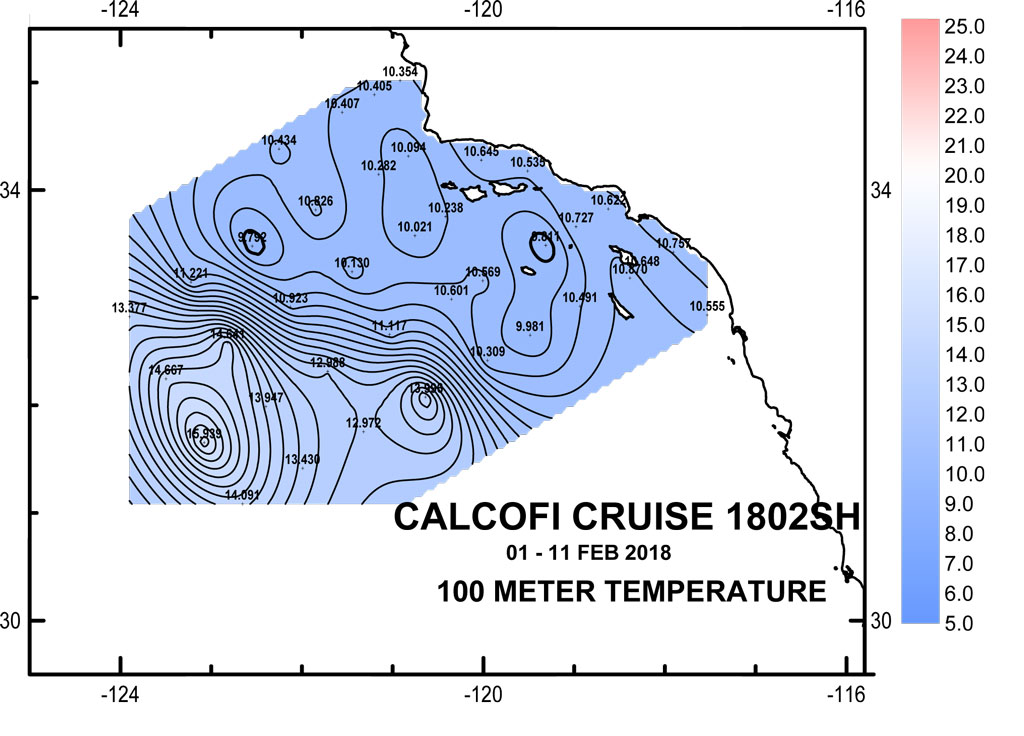
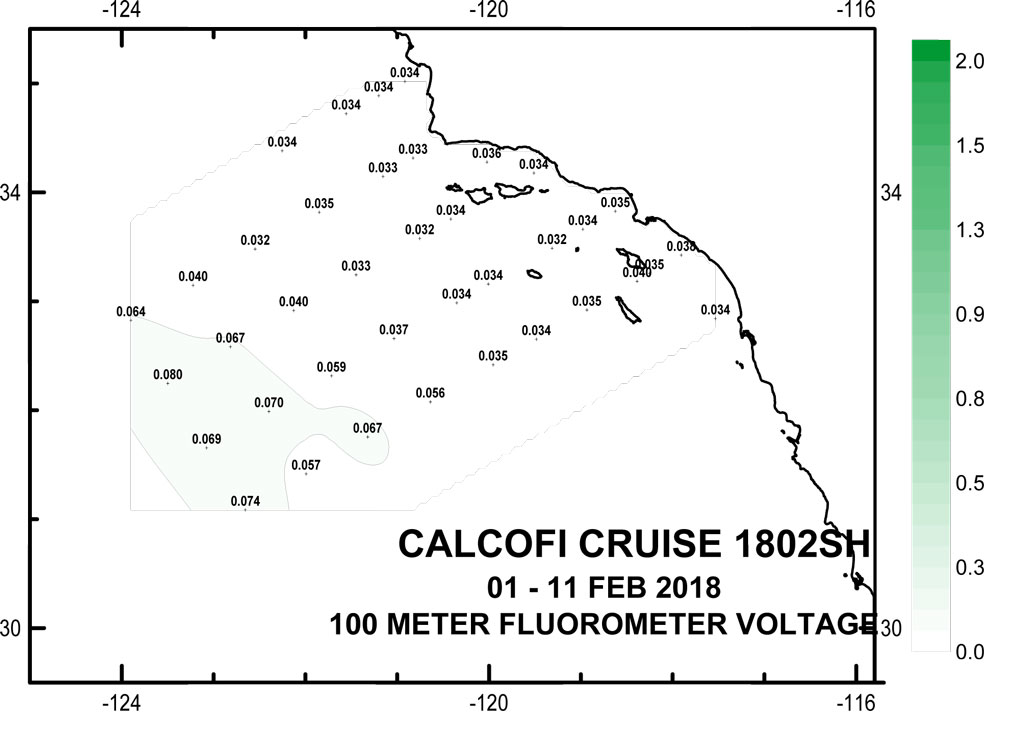
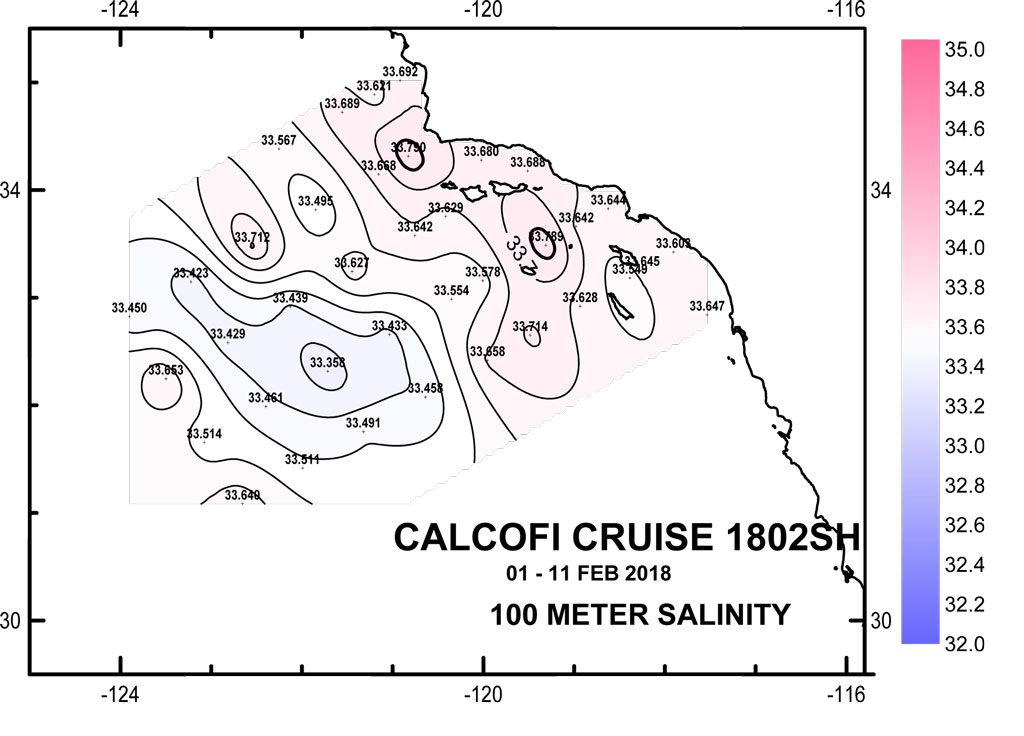
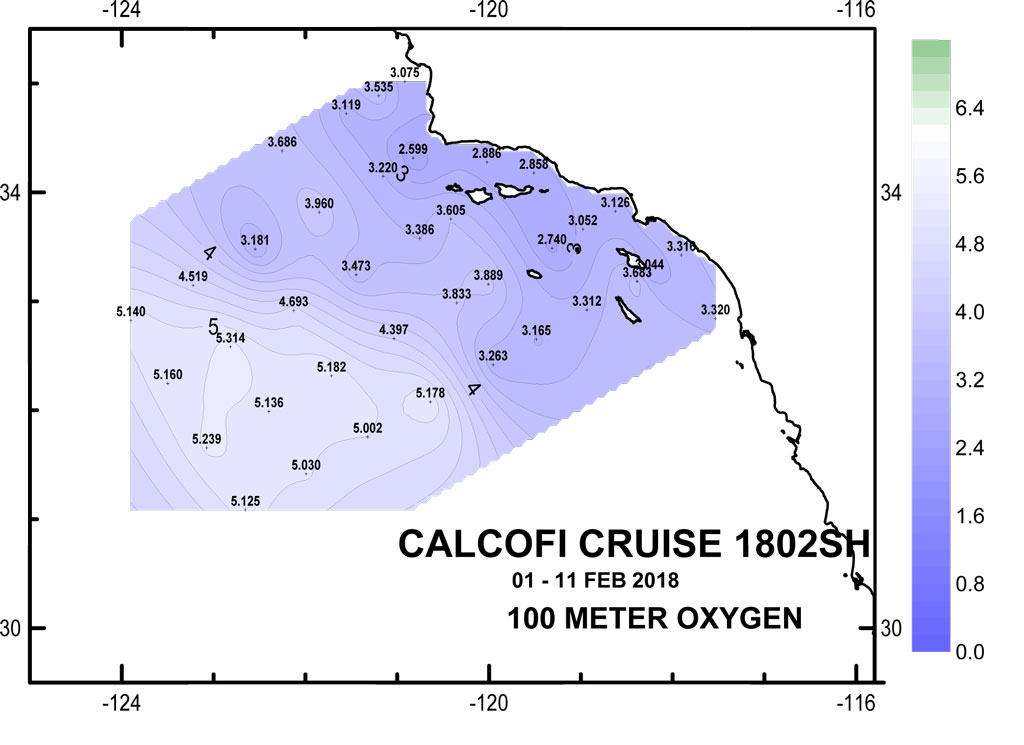
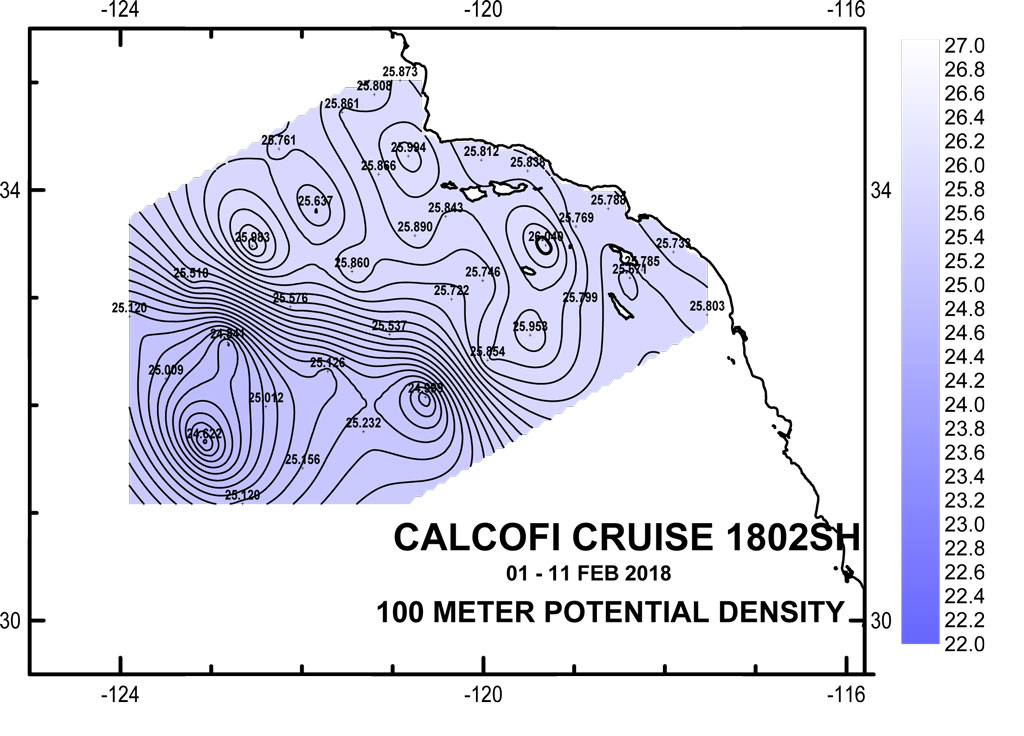
100 meter Preliminary CTD Data Contours
(Click for larger image)
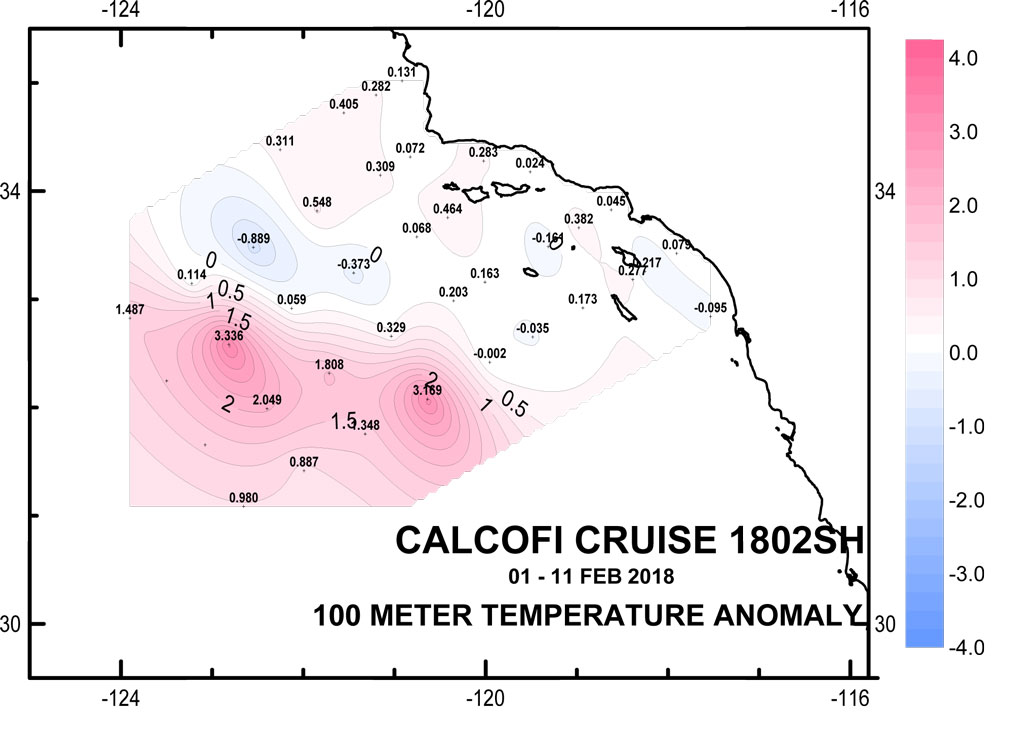
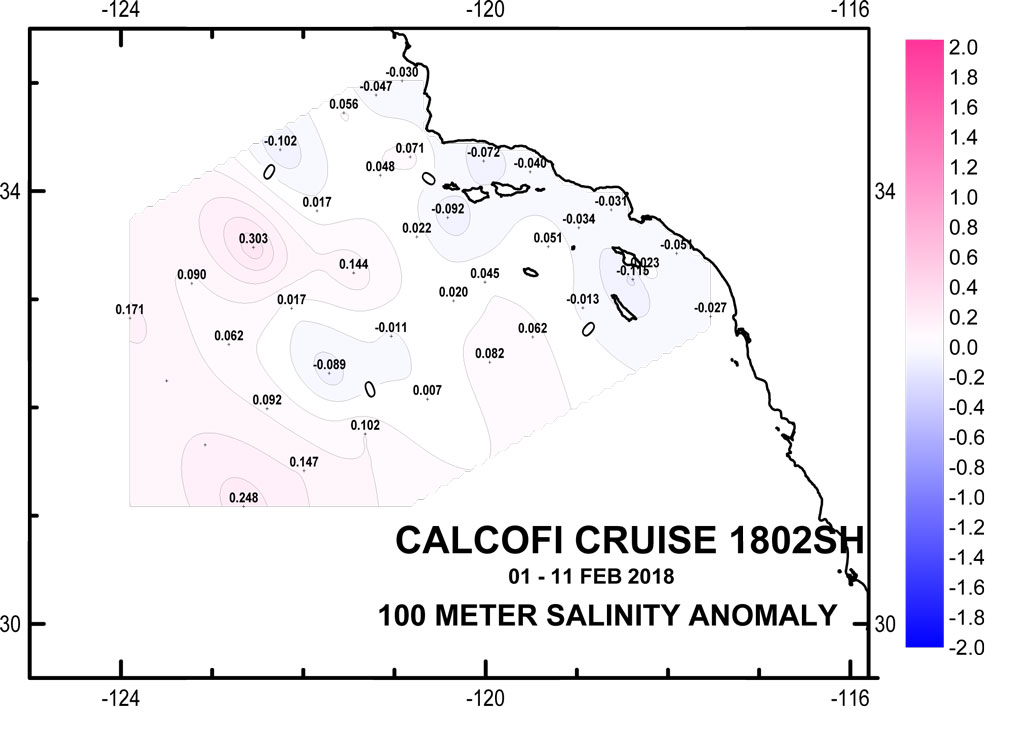
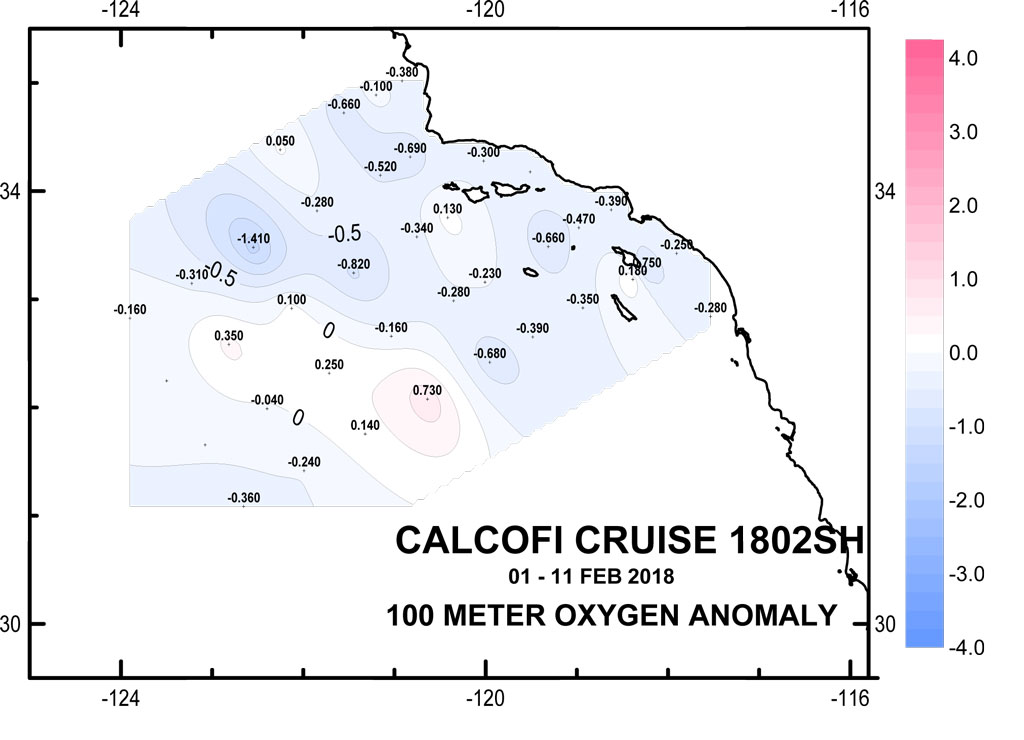
100 meter Anomaly Contours (50 yr mean)
(Click for larger image)
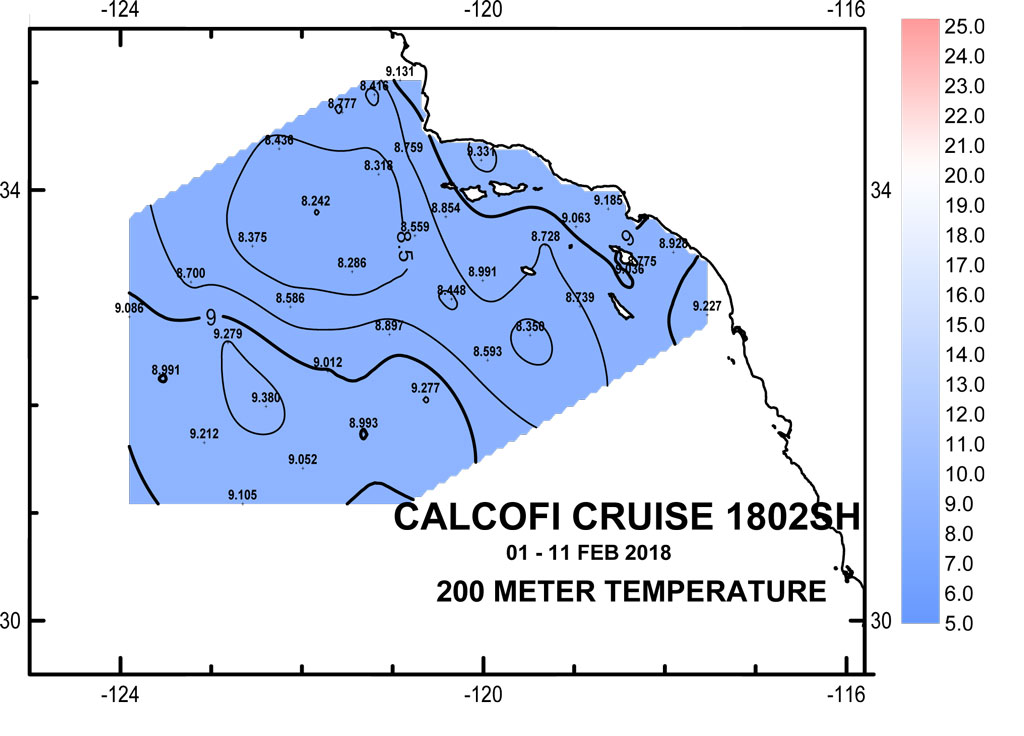
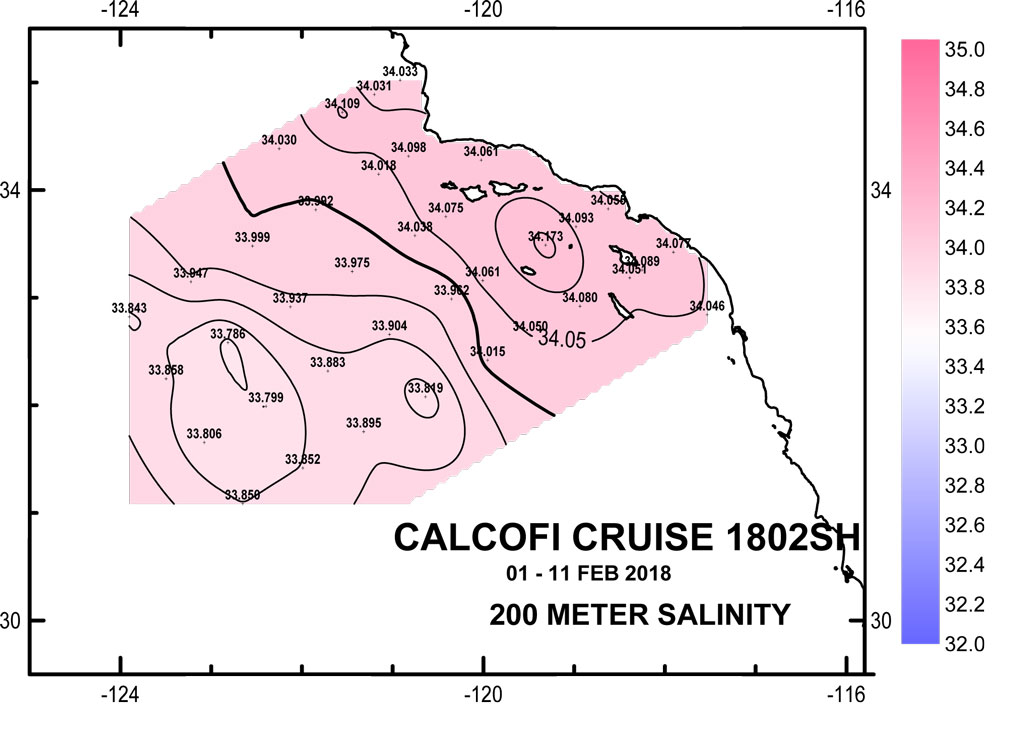
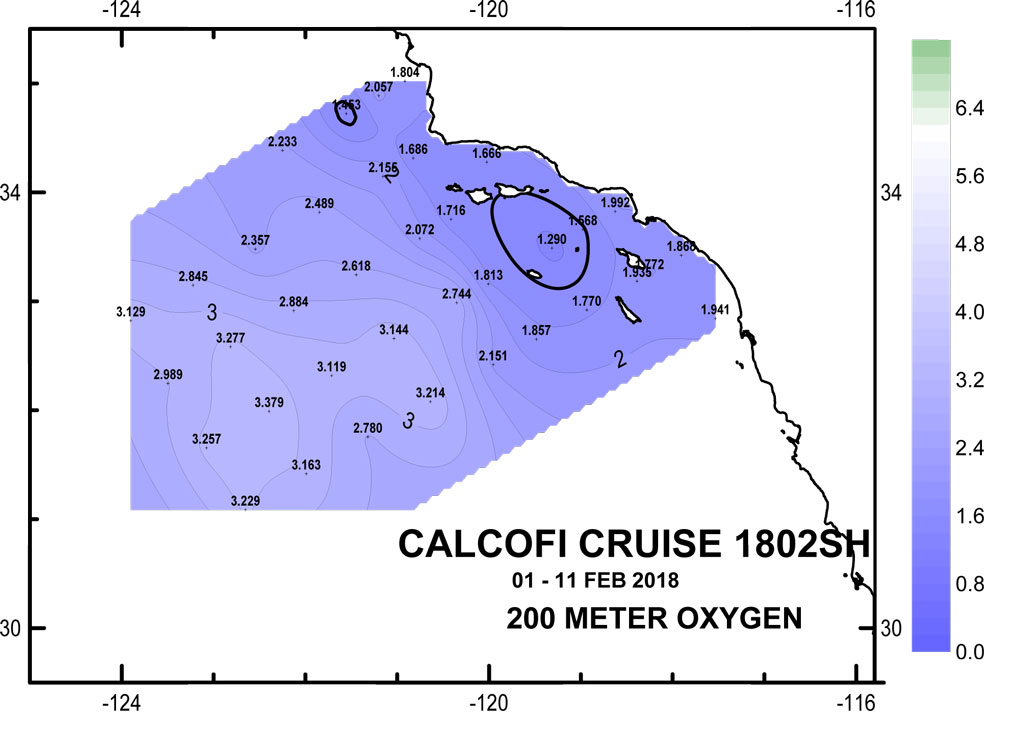
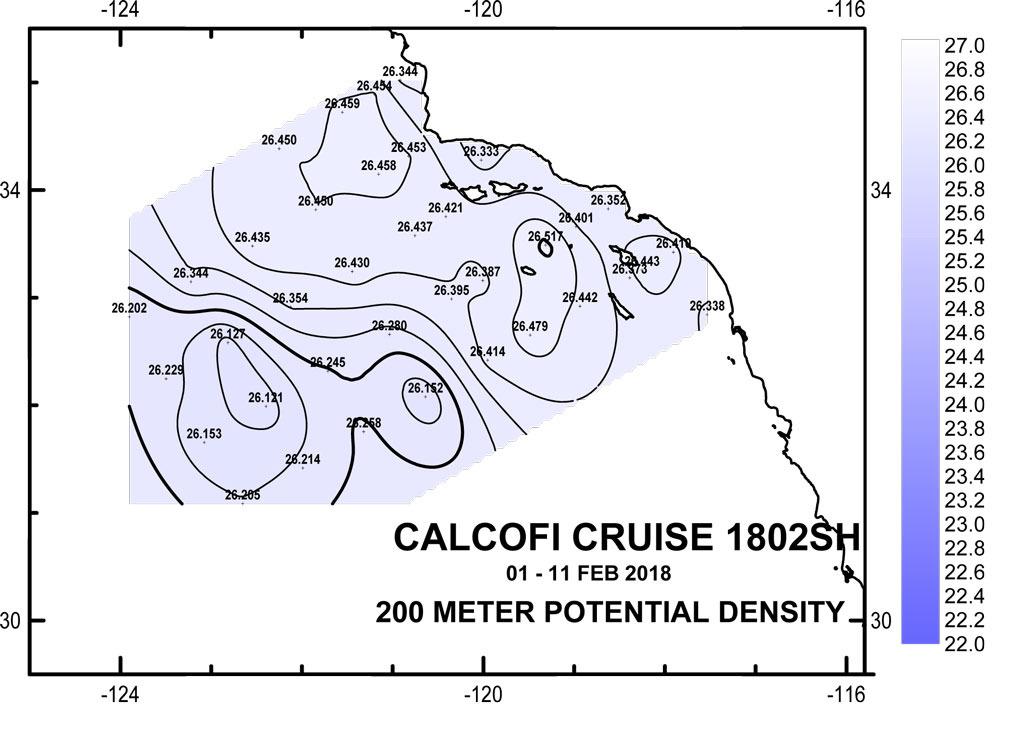
200 meter Preliminary CTD Data Contours
(Click for larger image)
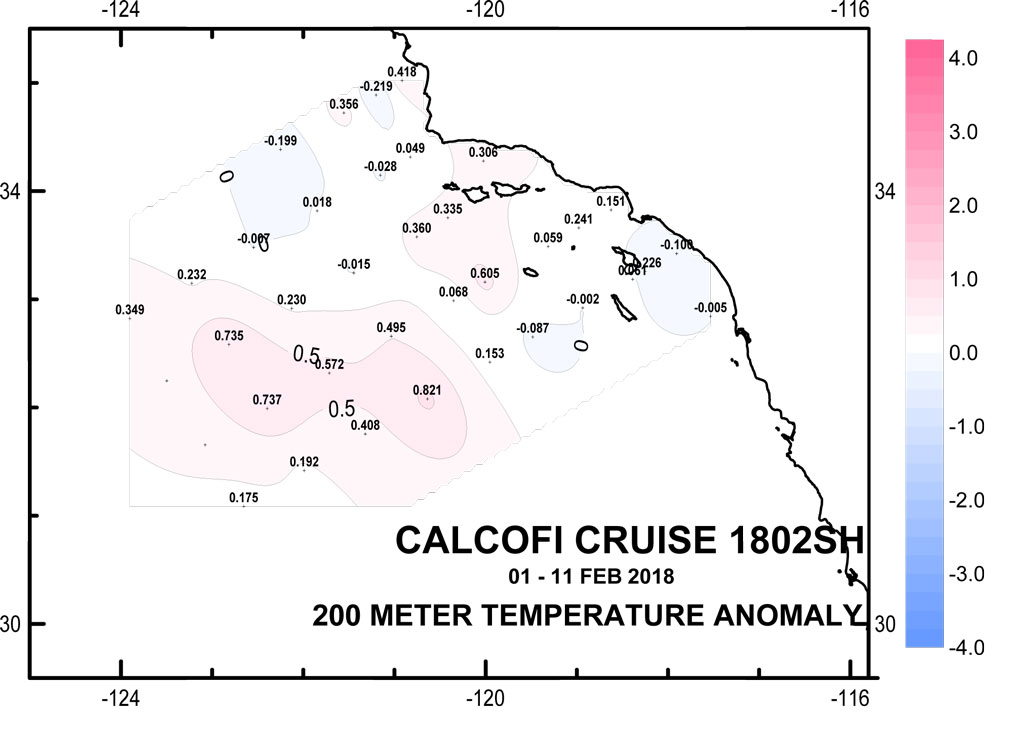
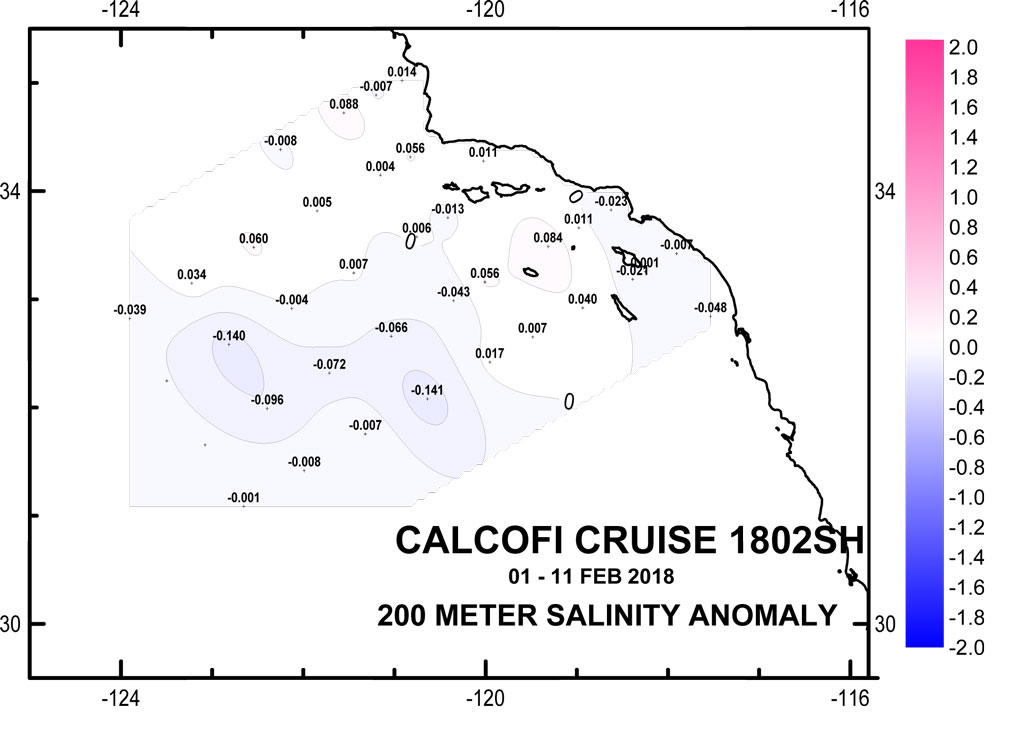
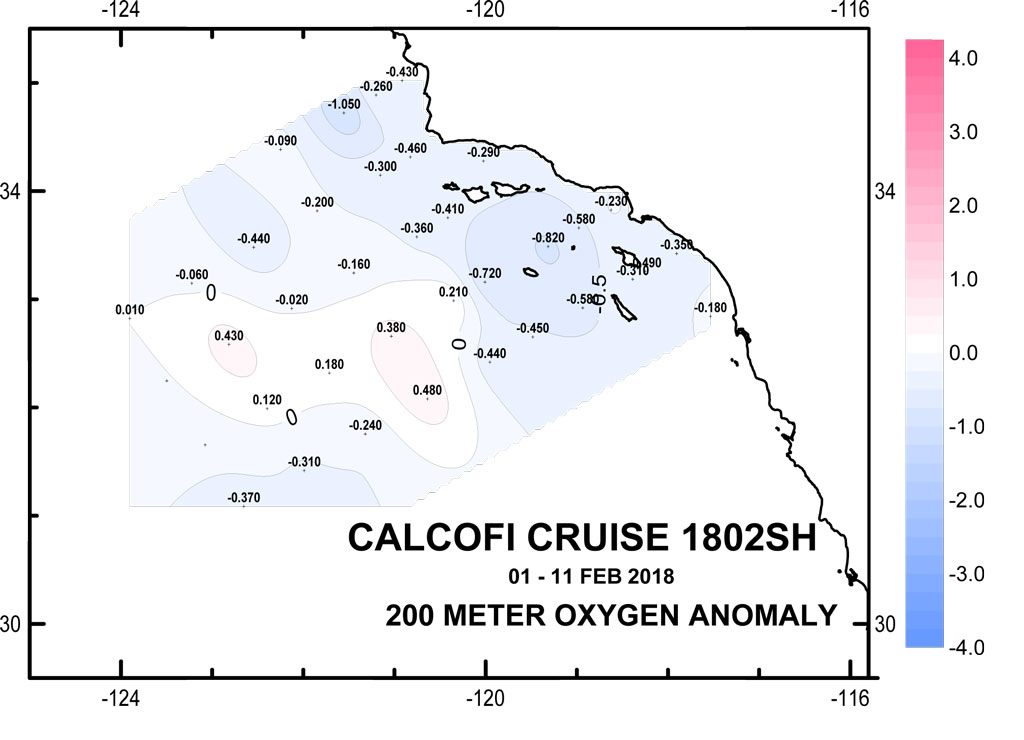
200 meter Anomaly Contours (50 yr mean)
(Click for larger image)
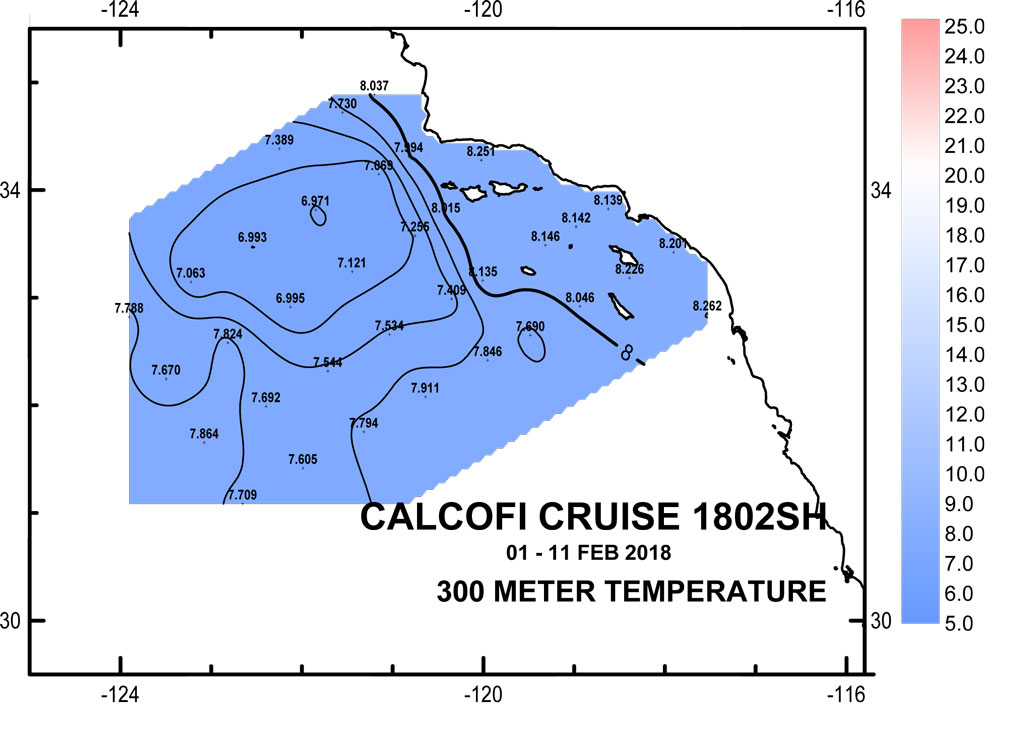
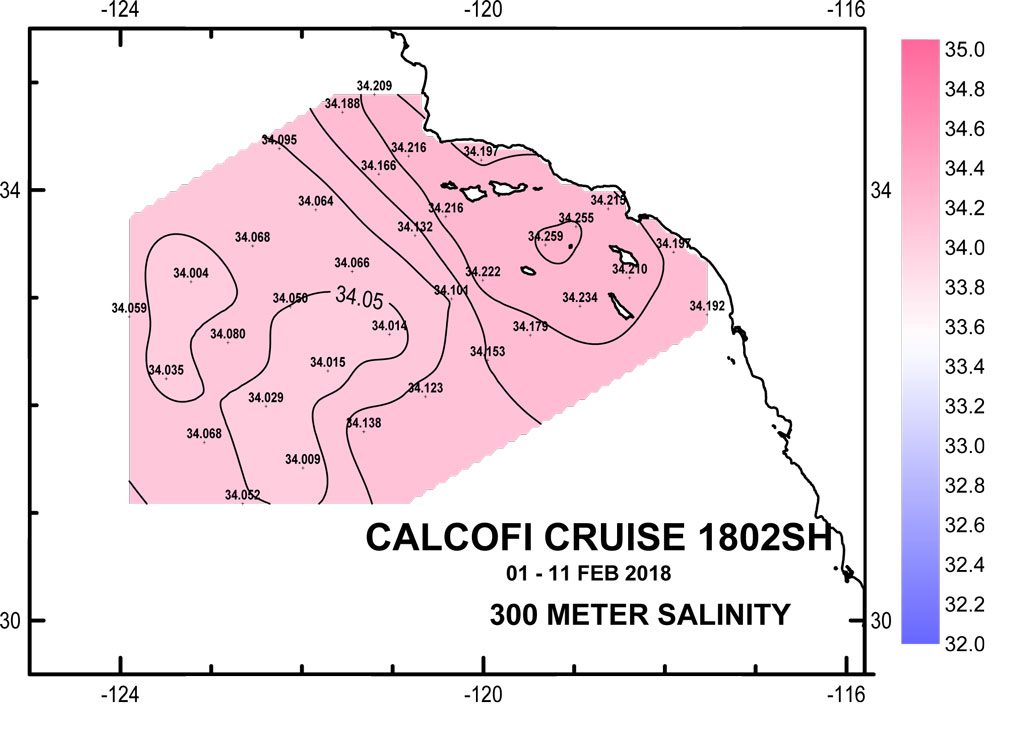
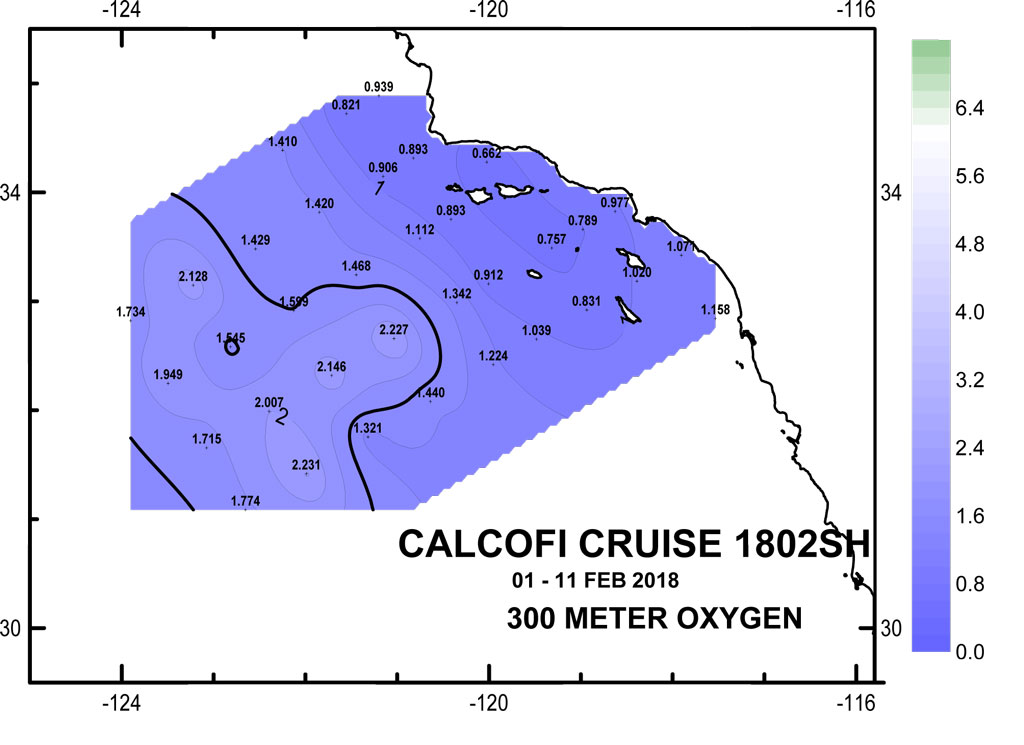
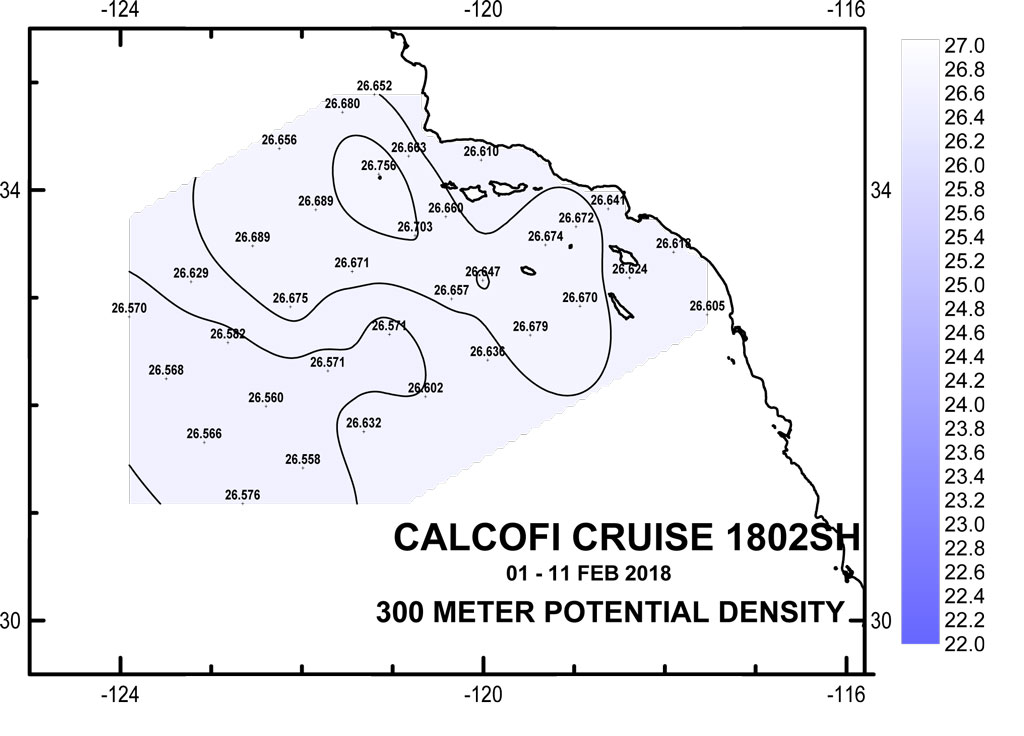
300 meter Preliminary CTD Data Contours
(Click for larger image)
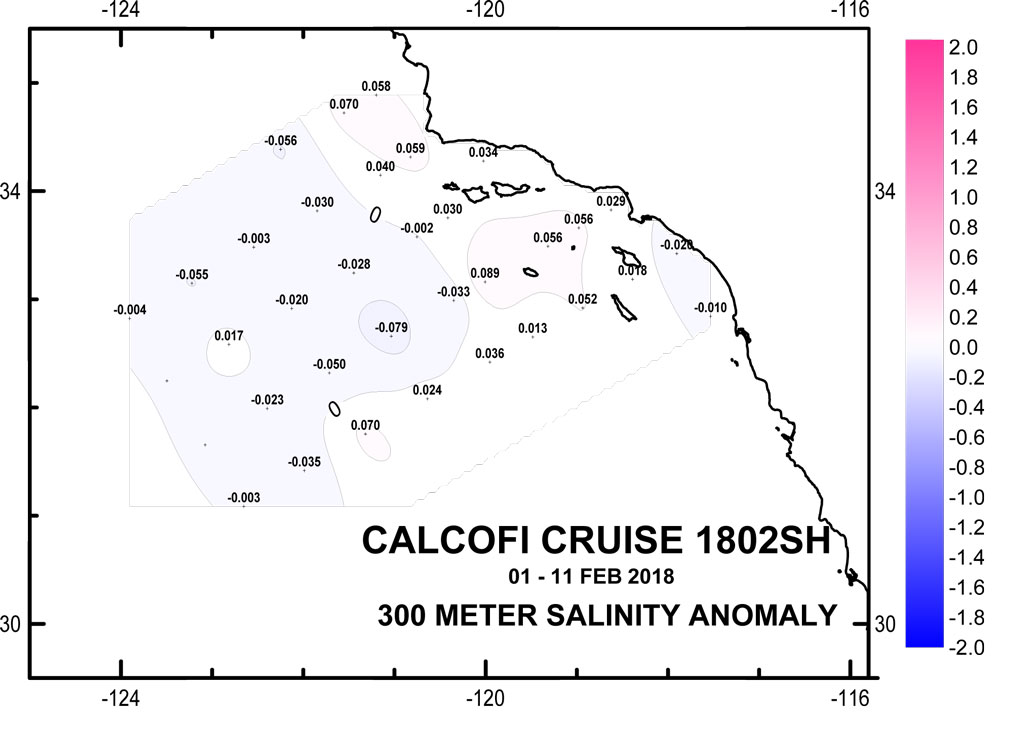
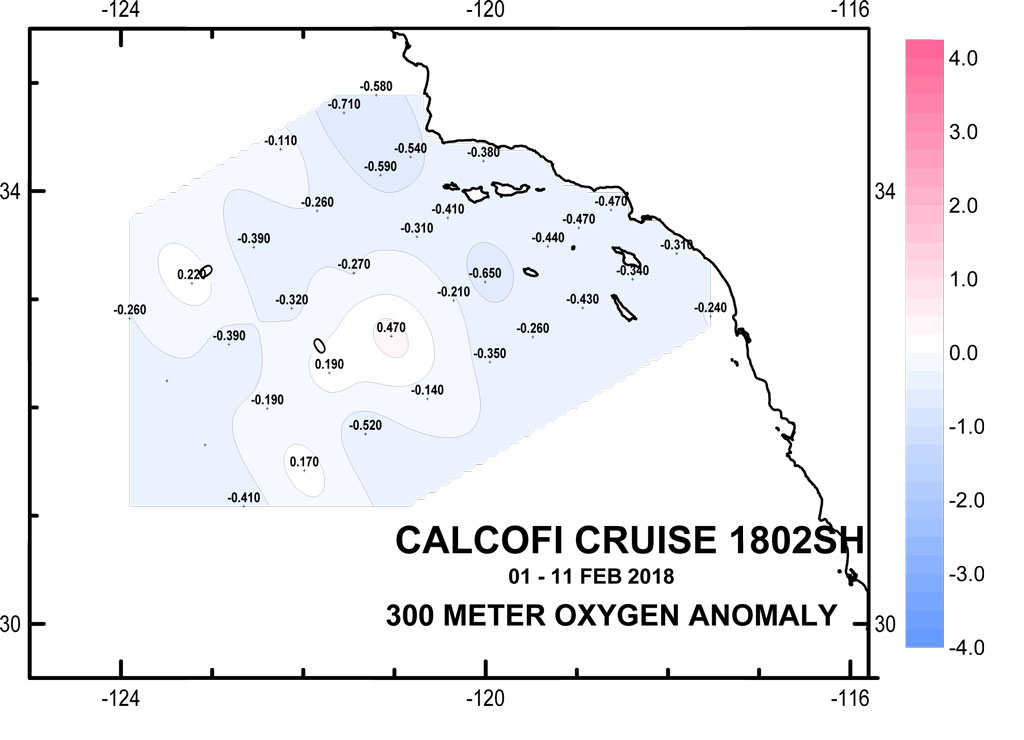
300 meter Anomaly Contours (50 yr mean)
(Click for larger image)
CTD Processing Notes
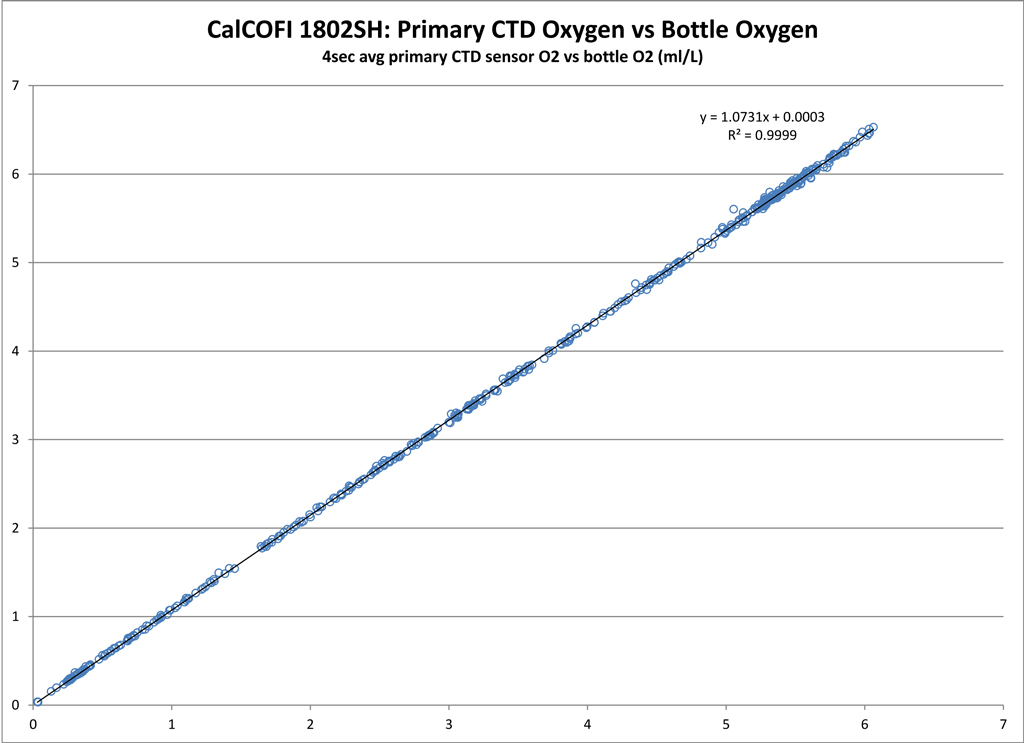
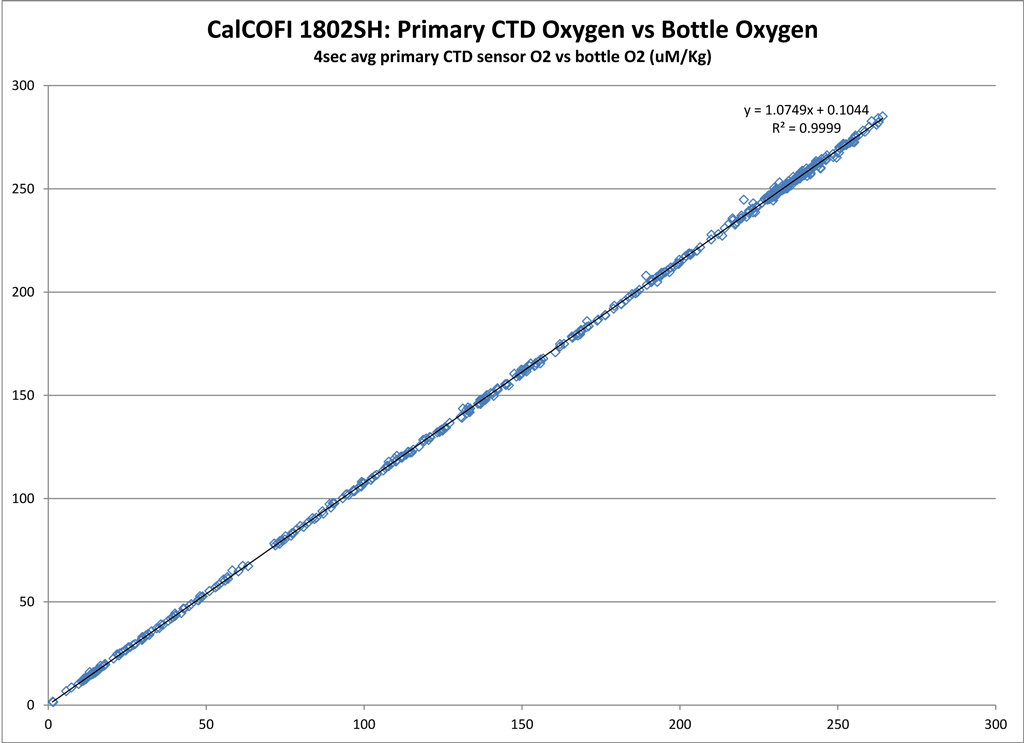
CTD Sensor Corrections:
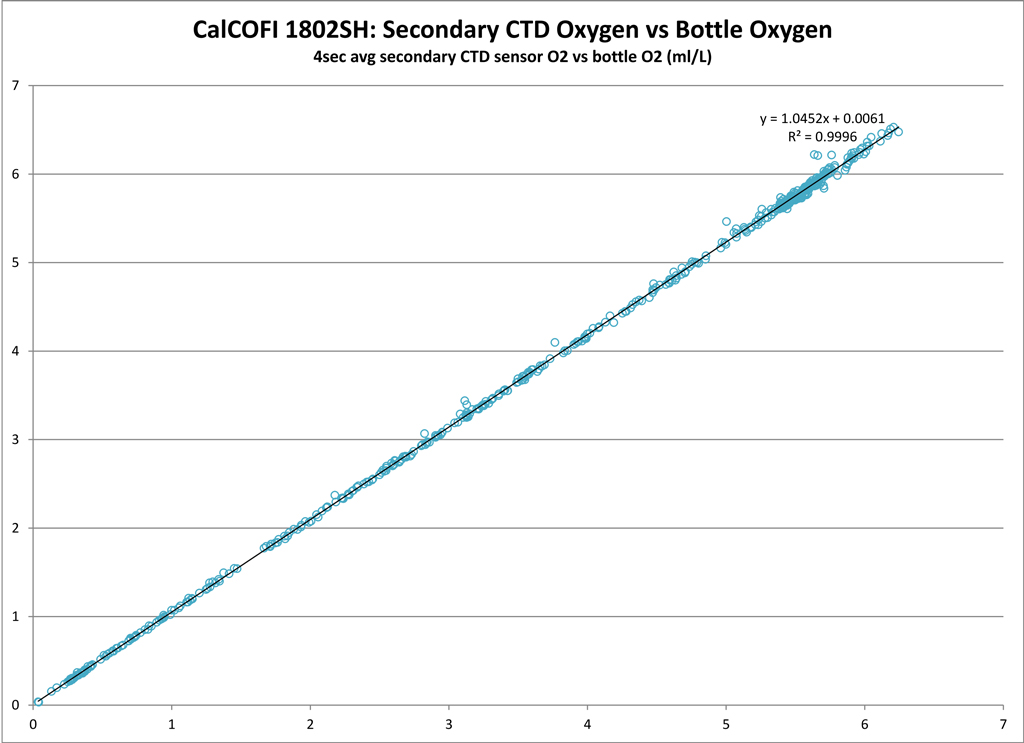
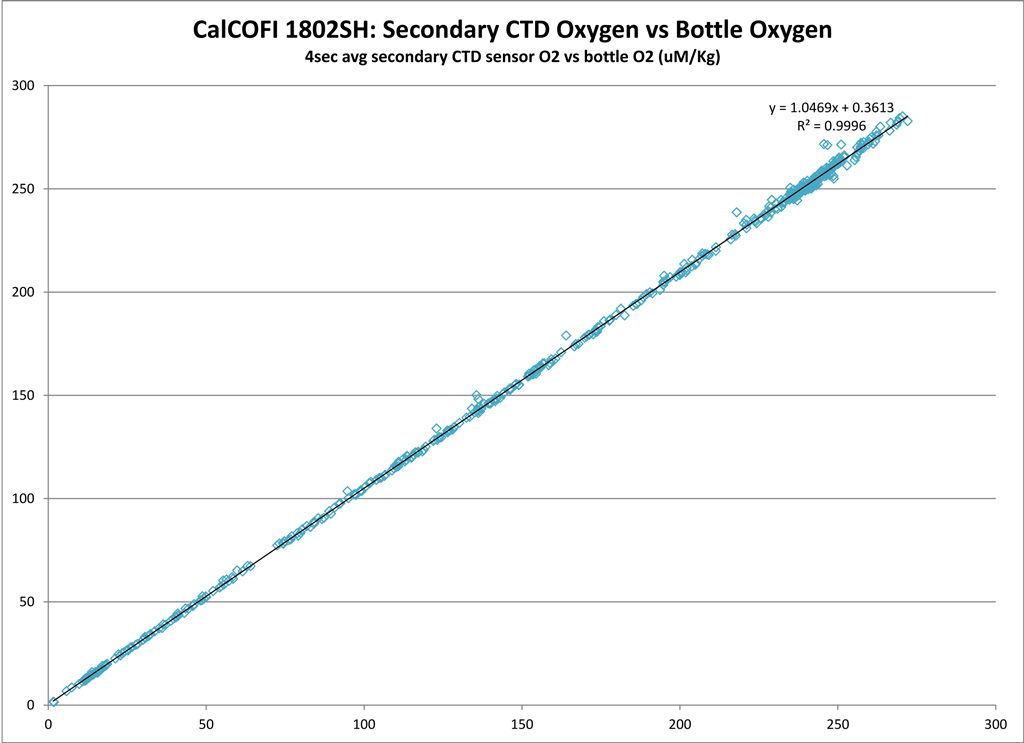
Derived by comparing sensor data (4 sec avg prior-to-bottle closure) to bottle samples.
Dual Salinity (Seabird SBE4) and Oxygen (Seabird SBE43) Sensors
PRIMARY SENSOR
SECONDARY SENSOR
Salinity offset (bottle - sensor; > 350 m)
0.0020
-0.0001
Oxygen ml/L
y = 1.0731x + 0.0003; R² = 0.9999
y = 1.0452x + 0.0061; R² = 0.9996
Oxygen umol/Kg
y = 1.0749x + 0.1044; R² = 0.9999
y = 1.0469x + 0.3613; R² = 0.9996
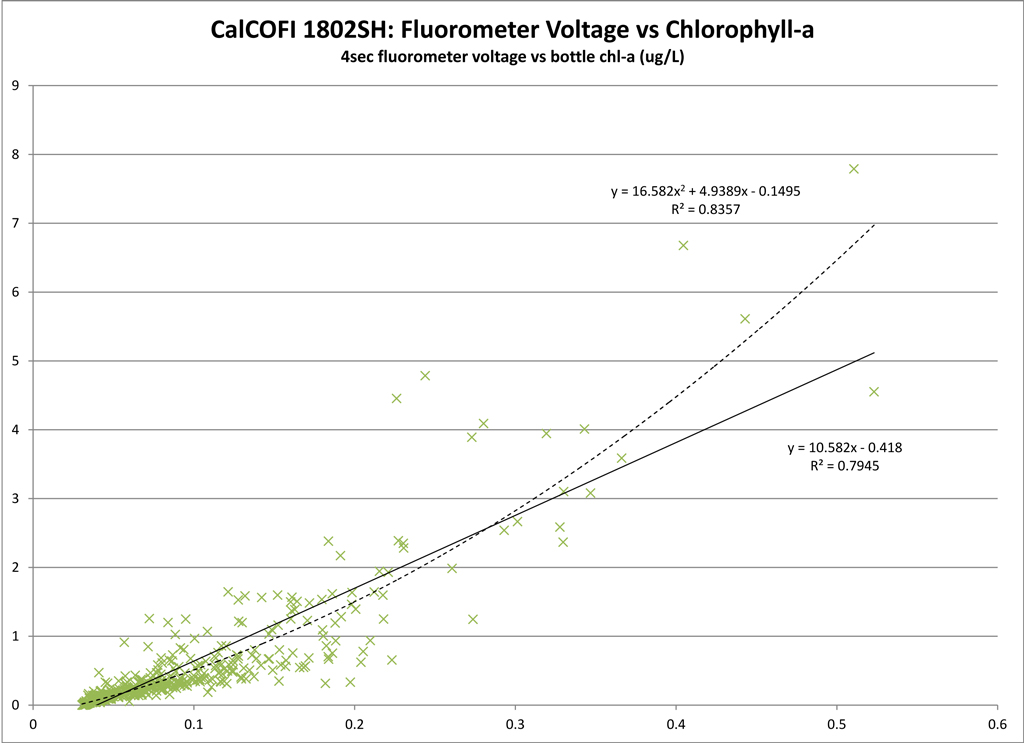
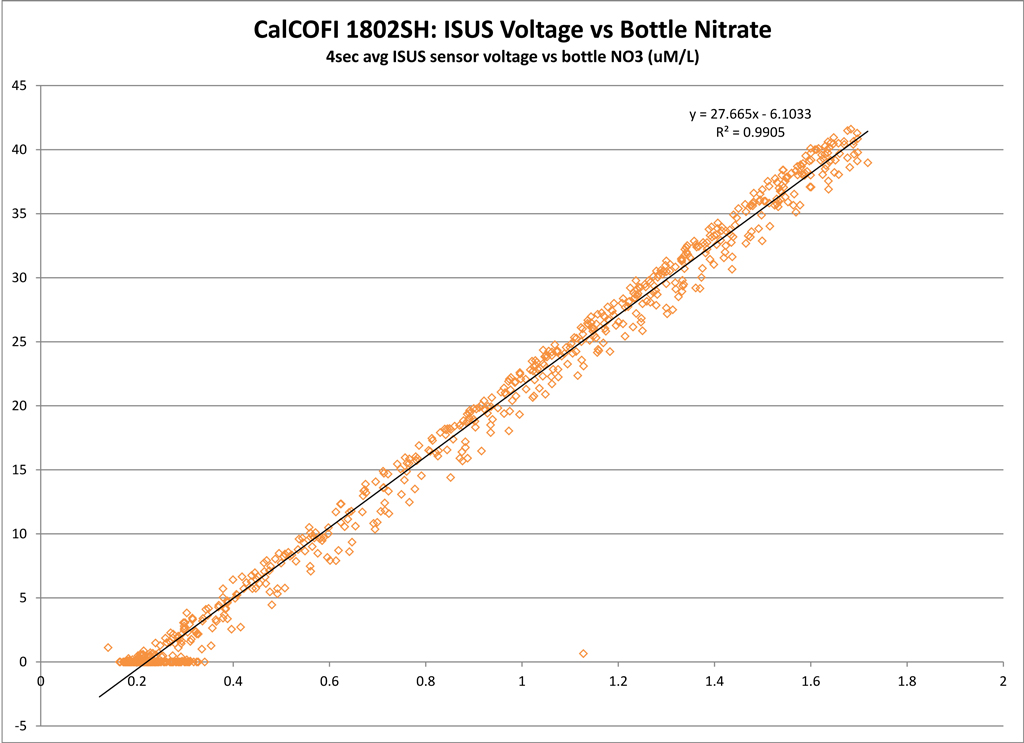
Single Nitrate (Satlantic ISUS v3 SN111) and Fluorescence (Wetlabs ECO AFL/FL) Sensors
LINEAR
POLYNOMIAL
Nitrate
y = 27.665x - 6.1033; R² = 0.9905
Fluorescence
y = 10.582x - 0.418; R² = 0.7945
y = 16.582x2 + 4.9389x - 0.1495; R² = 0.8357
Regressions:
Please note: these regressions are generated from preliminary CTD vs bottle data and will be reprocessed once final bottle data are available. CTD temperatures and salinities do not usually change but oxygen, chlorophyll-a, and nitrate may change significantly after QAQC. Questionable or mistrip bottle data are removed from these comparisons but may be visible on the CTD.csv plots. For this cruise and future cruises, both primary & secondary sensor profiles vs bottle data will be generated and archived in the downloadable CTD+Bottle data files. These plots are under the “csv-plots\Primary” & “csv-plots\Secondary” subdirectories.