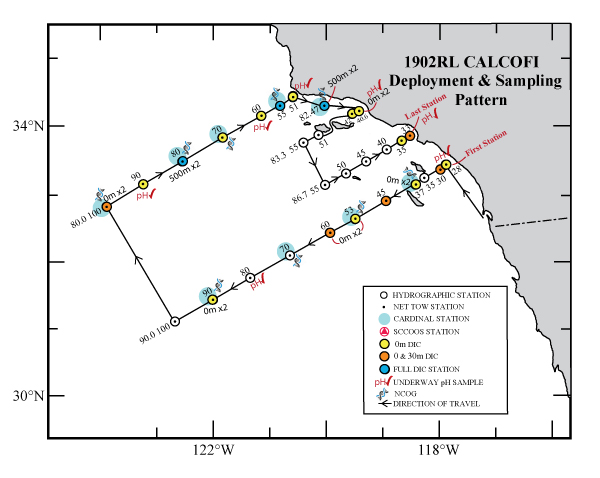
CalCOFI 1902RL sailed on NOAA Ship Reuben Lasker on 6 Feb 2019 from 10th Avenue Marine Terminal, San Diego. 29 of 75 science stations were successfully occupied. CalCOFI’s original January winter cruise was postponed by the government shutdown. With the ship’s impeding dry dock schedule and another possible government shutdown Feb 15th, our winter cruise was compressed into 8 days at sea. Core stations on Line 90 & 80 out to 100 were the focus. Additional stations on Lines 83 (83.3) & 87 (86.7) out to station 60 were planned, time-permitting. We were able to occupy 29 of 31 stations, dropping 83.60 & 87.60 due to lack of ship time. All station work – CTD-rosette; Bongo, Pairovet, PRPOOS, Manta Net tows; NCOG & DIC sampling were performed. The cruise ended at 10th Avenue Marine Terminal, San Diego on 13 Feb 2019.
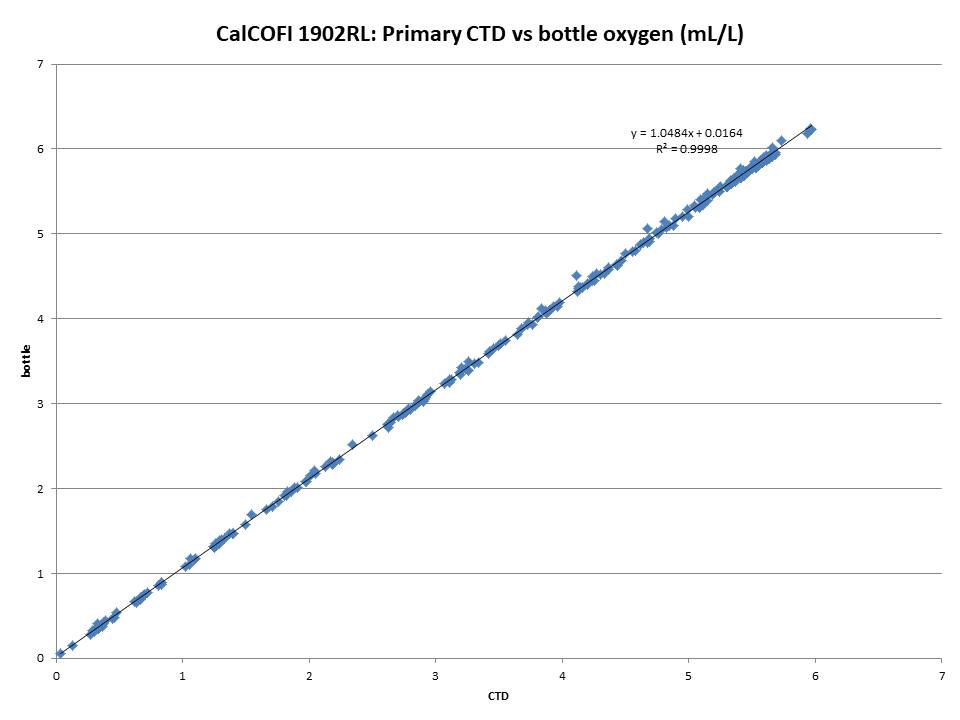
Derived by comparing sensor data (4 sec avg prior-to-bottle closure) to bottle samples.
Dual Salinity (Seabird SBE4) and Oxygen (Seabird SBE43) Sensors
PRIMARY SENSOR
SECONDARY SENSOR
Salinity offset (bottle - sensor; > 350 m)
0.0010
-0.0044
Oxygen ml/L
y = 1.0484x + 0.0164; R² = 0.9998
y = 1.0779x + 0.0441; R² = 0.9997
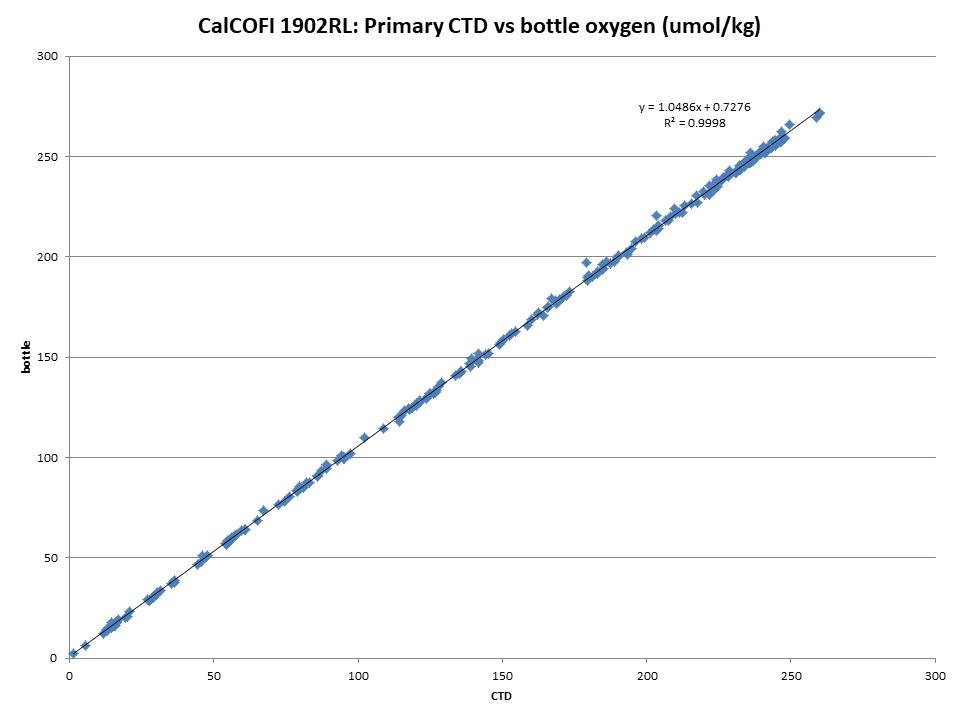
Oxygen umol/Kg
y = 1.0486x + 0.7276; R² = 0.9998
y = 1.0781x + 1.9354; R² = 0.9996
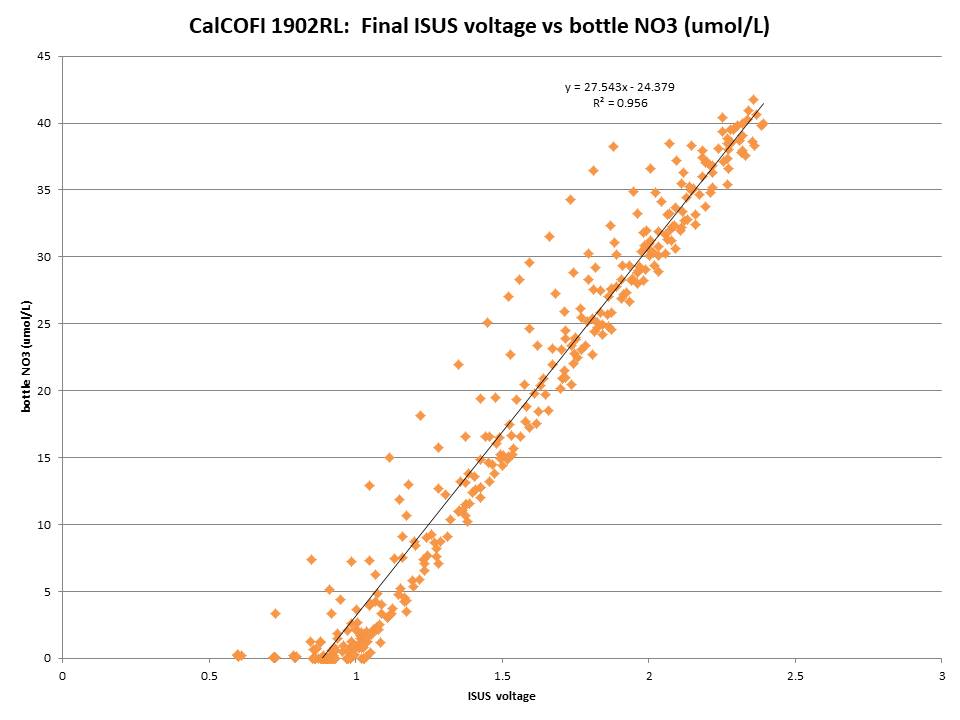
Single Nitrate (Satlantic ISUS v3 SN111) and Fluorescence (Wetlabs ECO AFL/FL) Sensors
LINEAR
POLYNOMIAL
Nitrate
y = 27.543x - 24.379; R² = 0.956
Fluorescence
y = 11.664x - 0.4473; R² = 0.8618
y = 14.443x2+ 7.3964x - 0.2501; R² = 0.8826
Regressions:
Please note: these regressions are generated from preliminary CTD vs bottle data and will be reprocessed once final bottle data are available. CTD temperatures and salinities do not usually change but oxygen, chlorophyll-a, and nitrate may change significantly after QAQC. Questionable or mistrip bottle data are removed from these comparisons but may be visible on the CTD.csv plots. For this cruise and future cruises, both primary & secondary sensor profiles vs bottle data will be generated and archived in the downloadable CTD+Bottle data files. These plots are under the “csv-plots\Primary” & “csv-plots\Secondary” subdirectories.