CalCOFI 1904RL sailed on FSV Reuben Lasker on 02 Apr 2019 at 1230PDT from 10th Ave Marine Terminal, San Diego. 67 of 75 science stations were successfully occupied. CTD casts and various net tows were completed at each science station. Underway visual observations of marine mammals and avifauna were conducted while under transit. Other underway science included continuous pCO2/pH and meteorological measurements. The cruise ended Nimitz Marine Facility, San Diego on 19 Nov 2019 at 0800PDT.
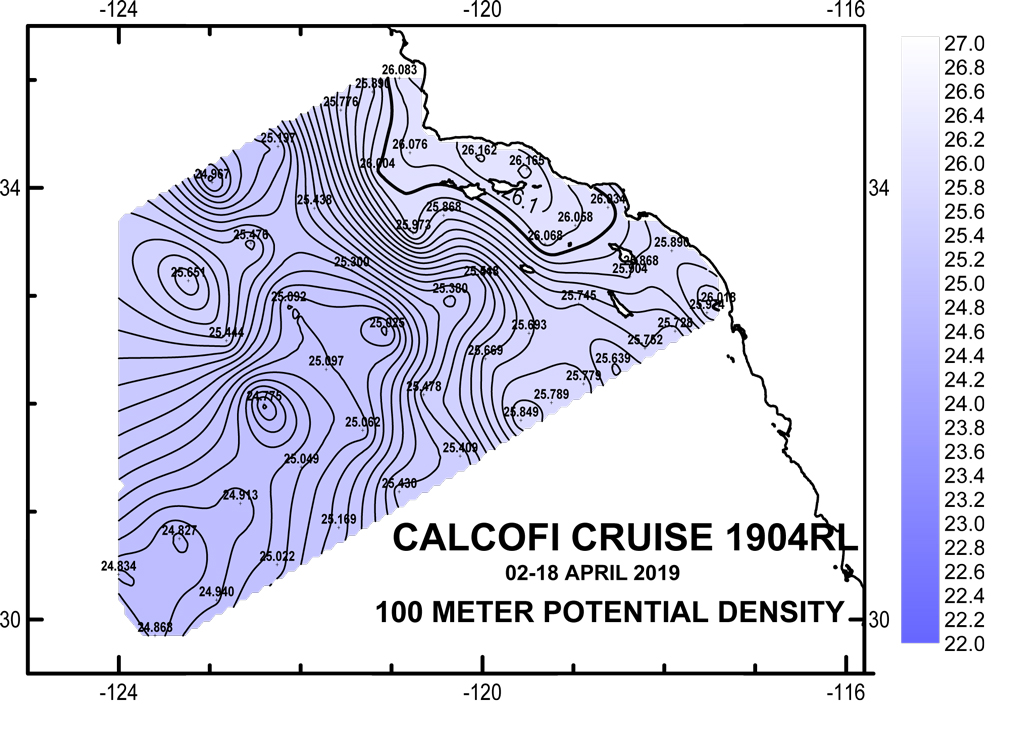
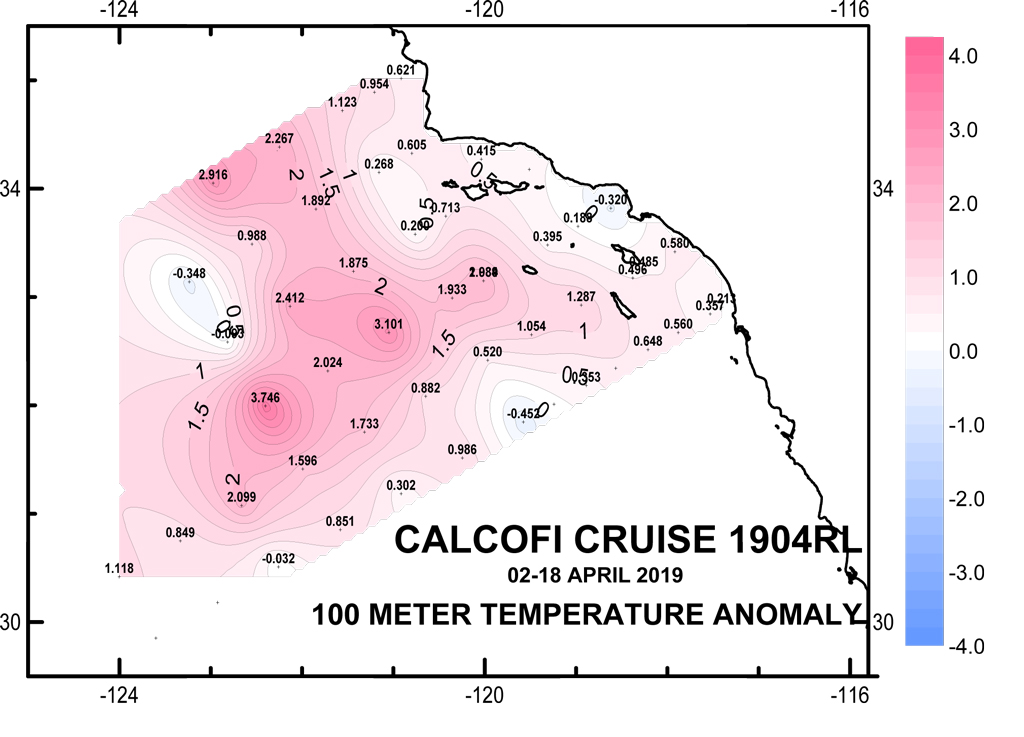
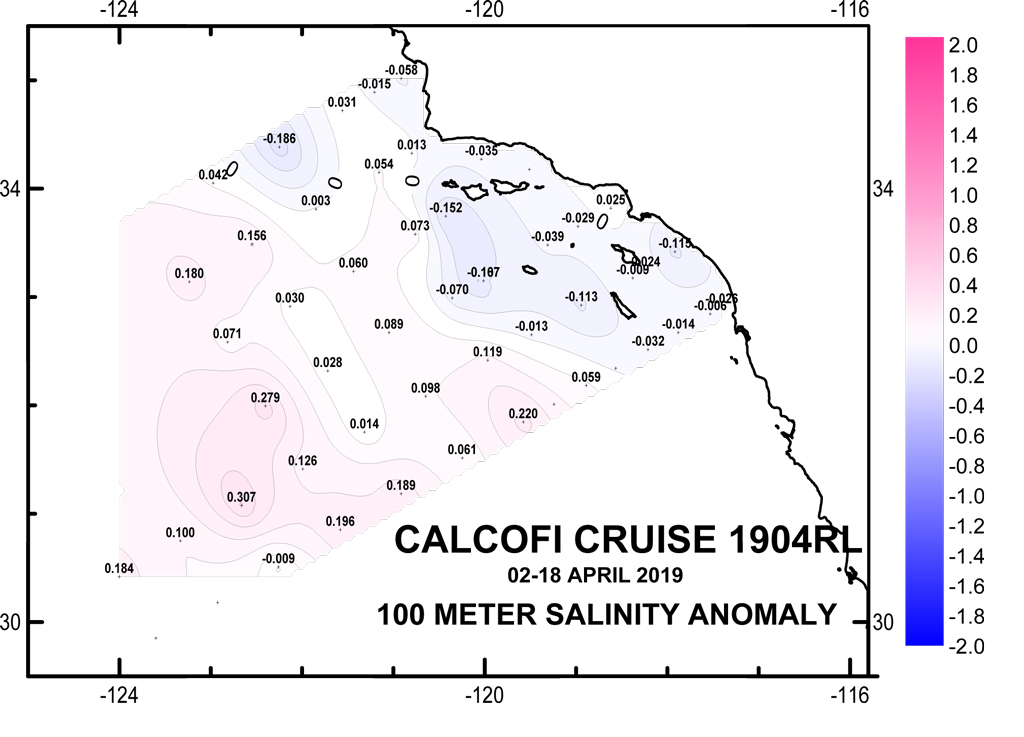
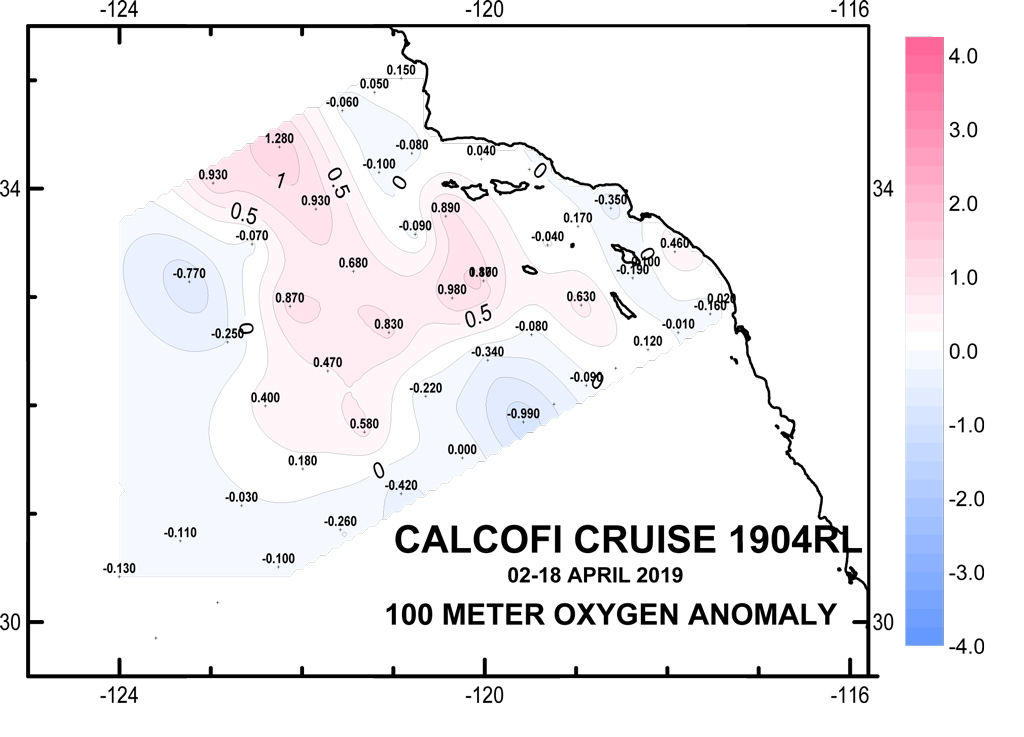
Please note: these data are 1m-bin-average Seasoft-processed CTD data that have not gone through quality control checks or bottle corrections. Anomalies are based on 50-year harmonics (1949-1999).
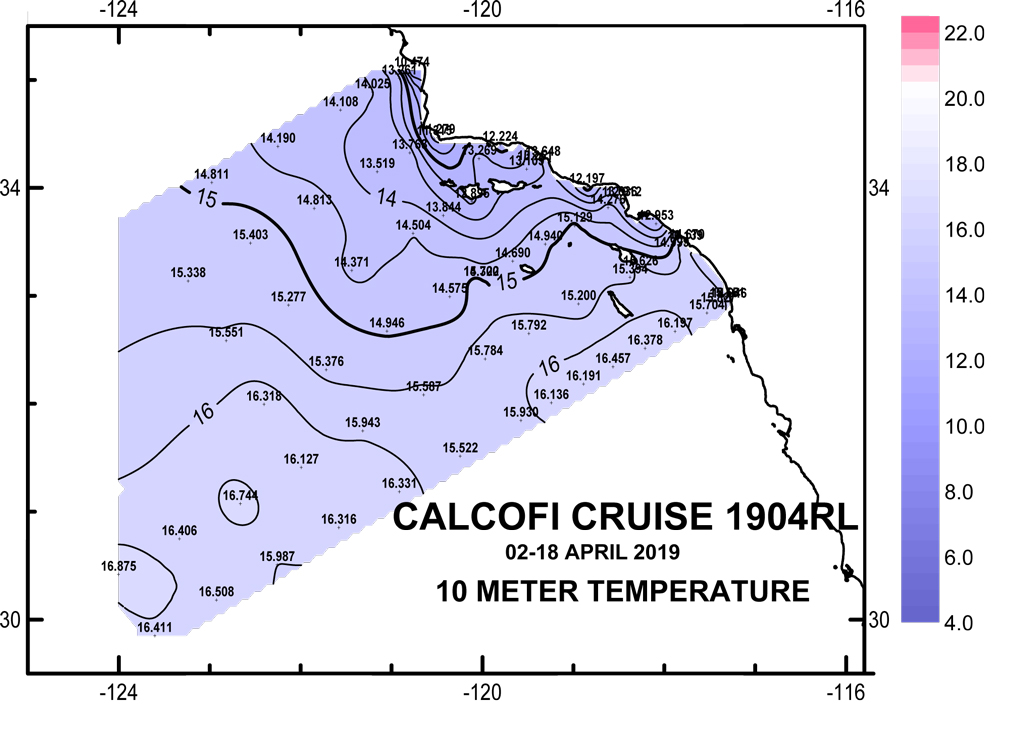
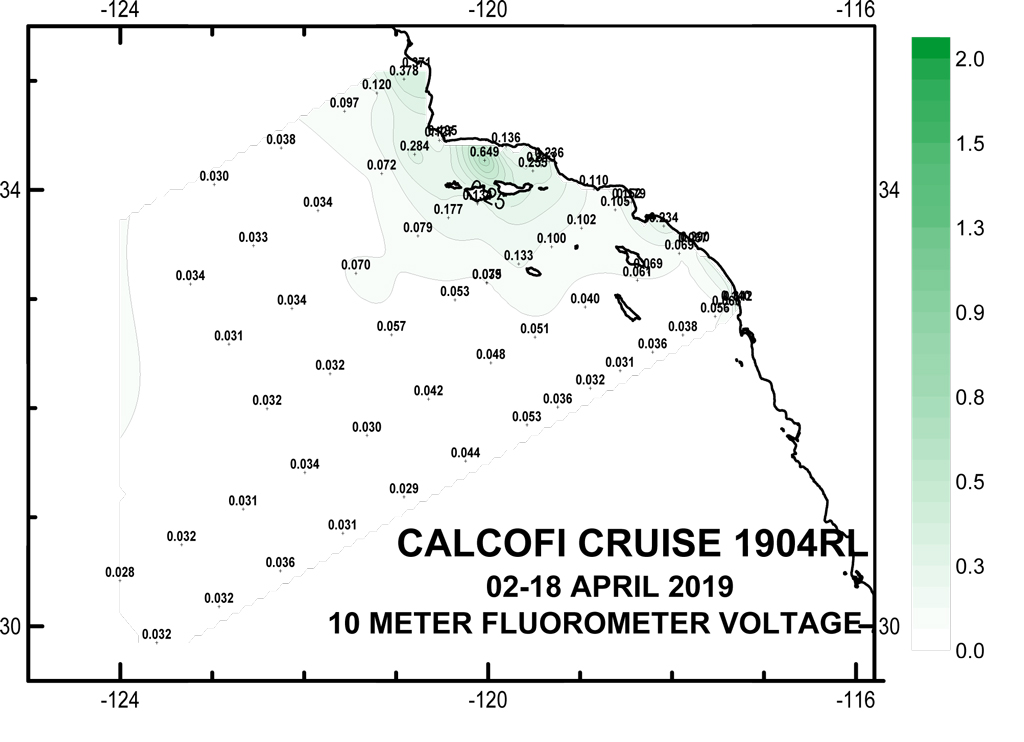
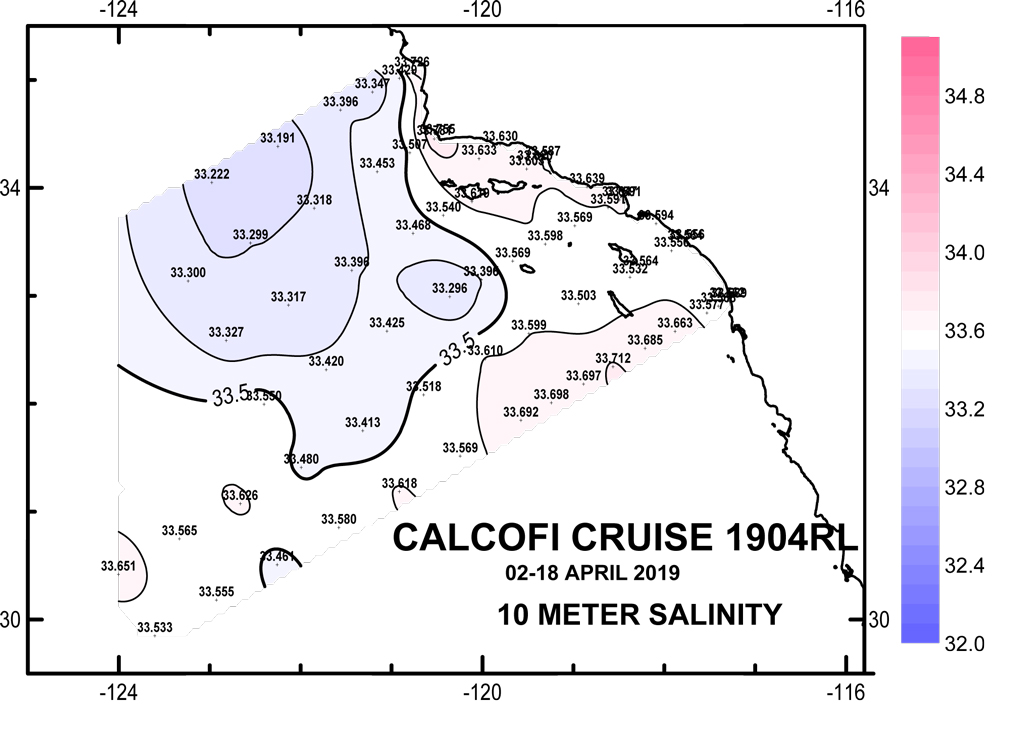
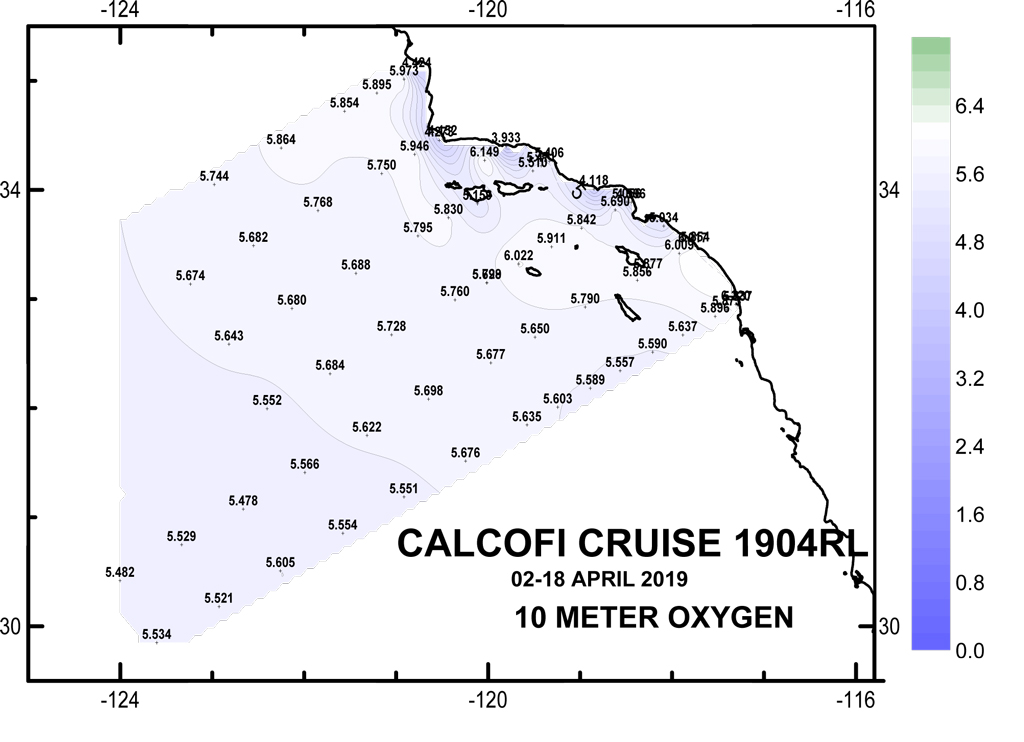
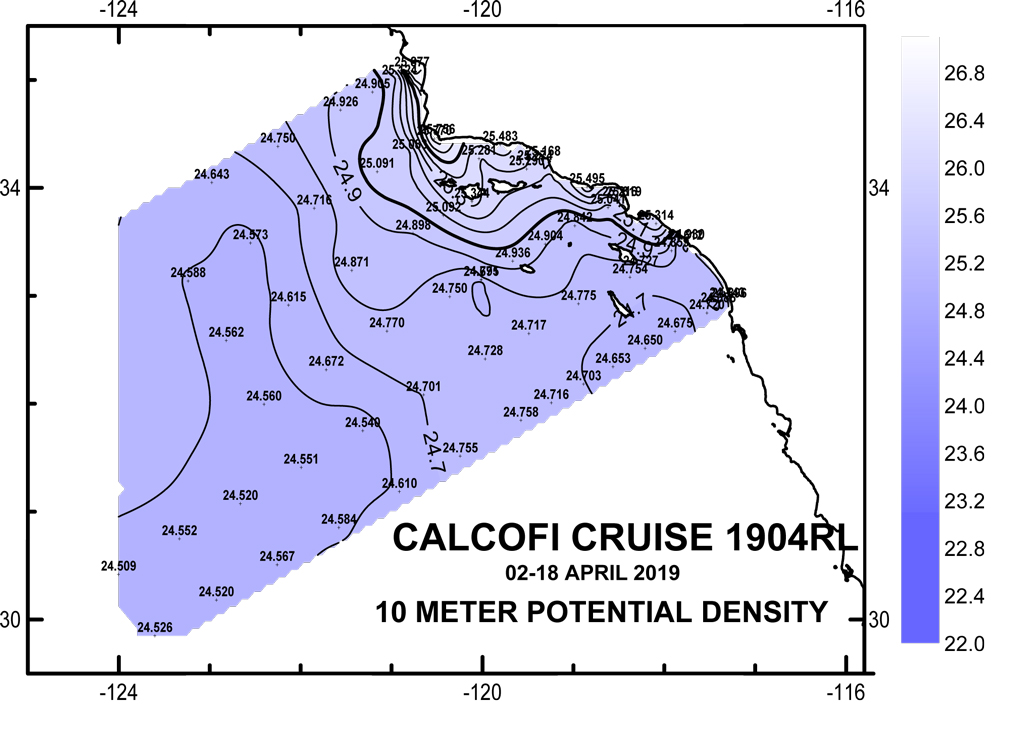
10 meter Preliminary CTD Data Contours
(Click for larger image)
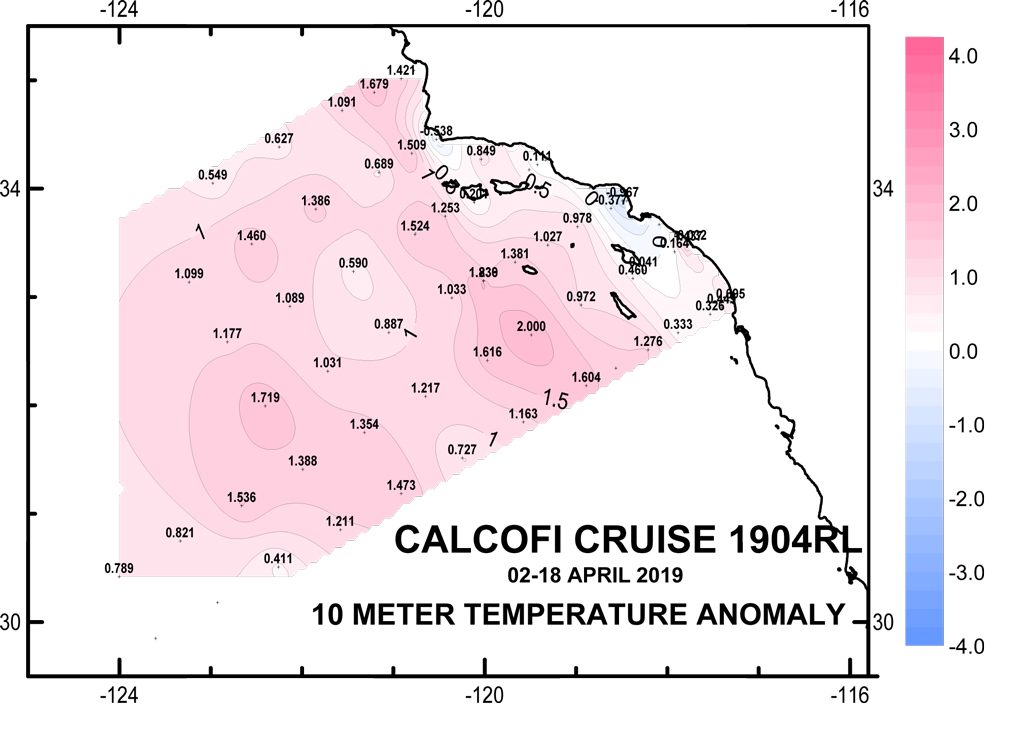
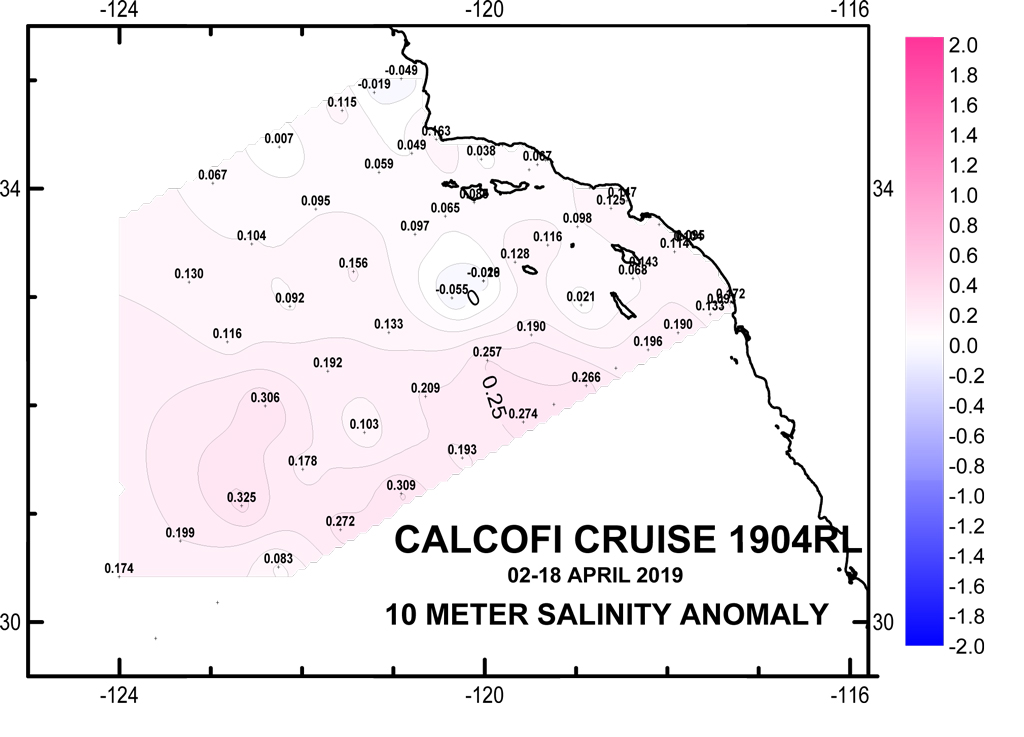
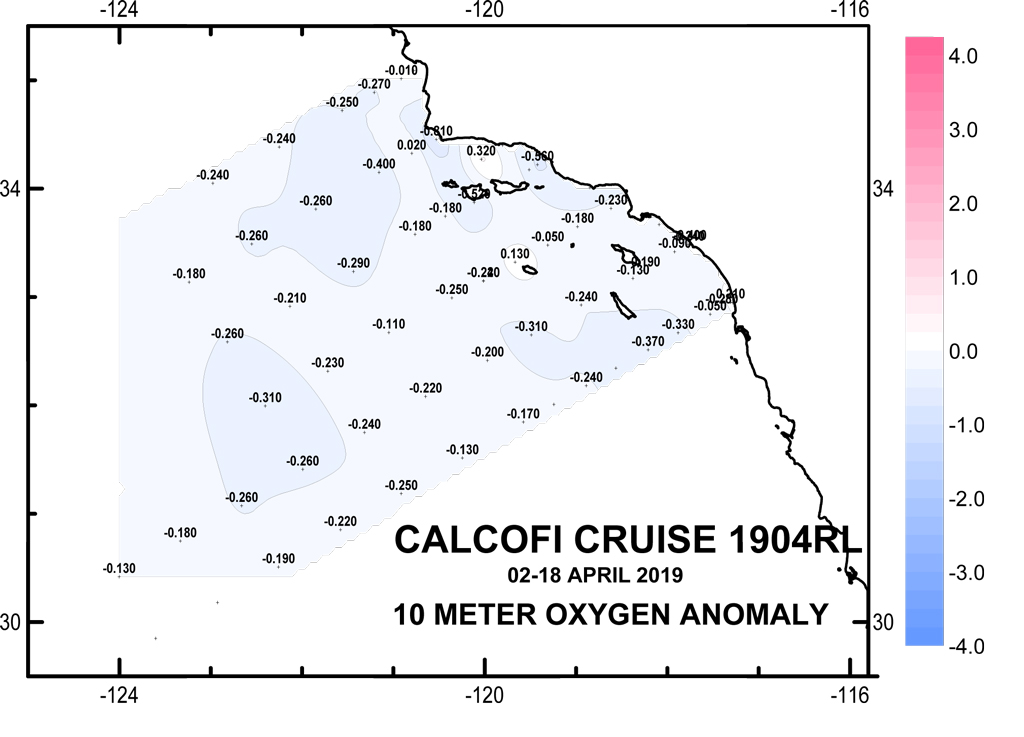
10 meter Anomaly Contours (50 yr mean)
(Click for larger image)
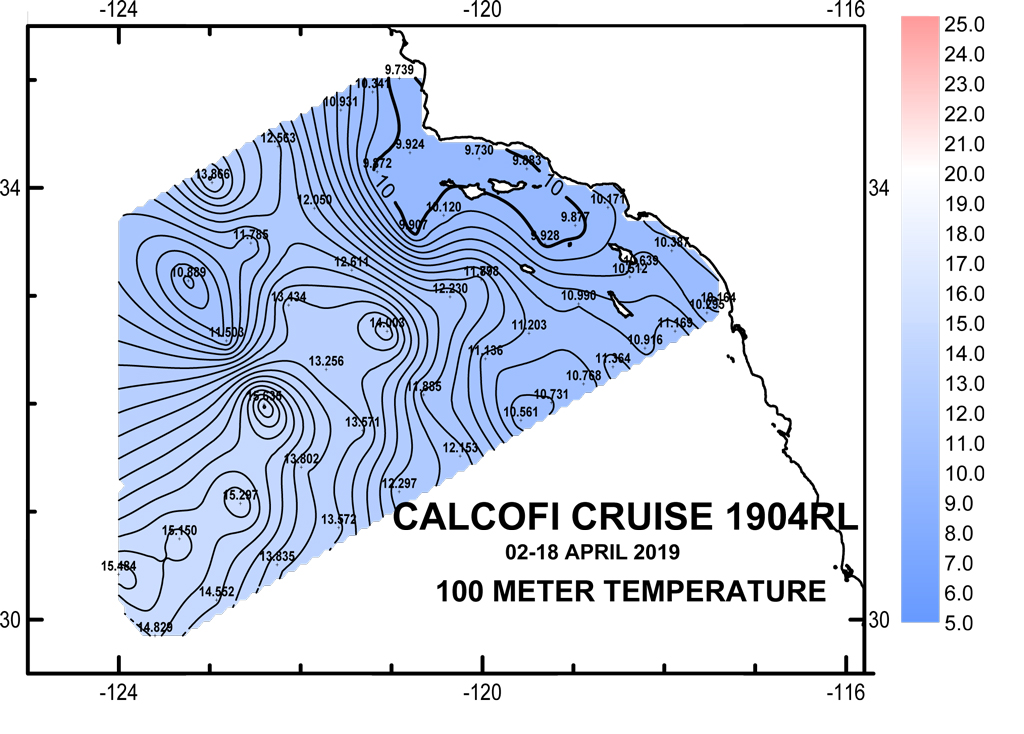
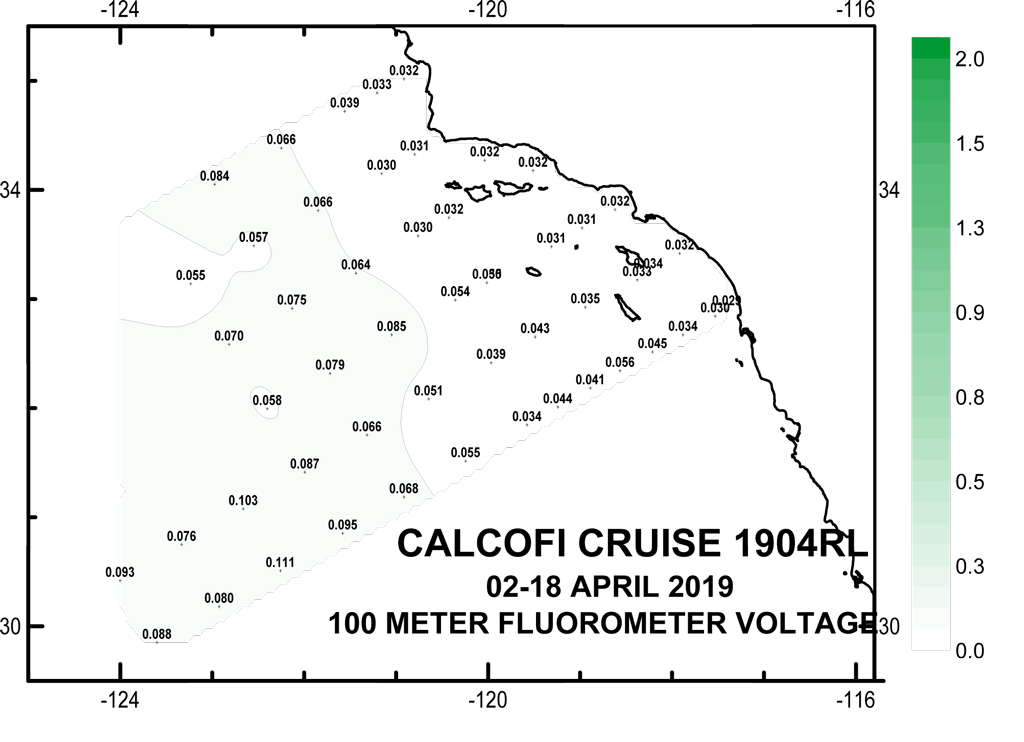
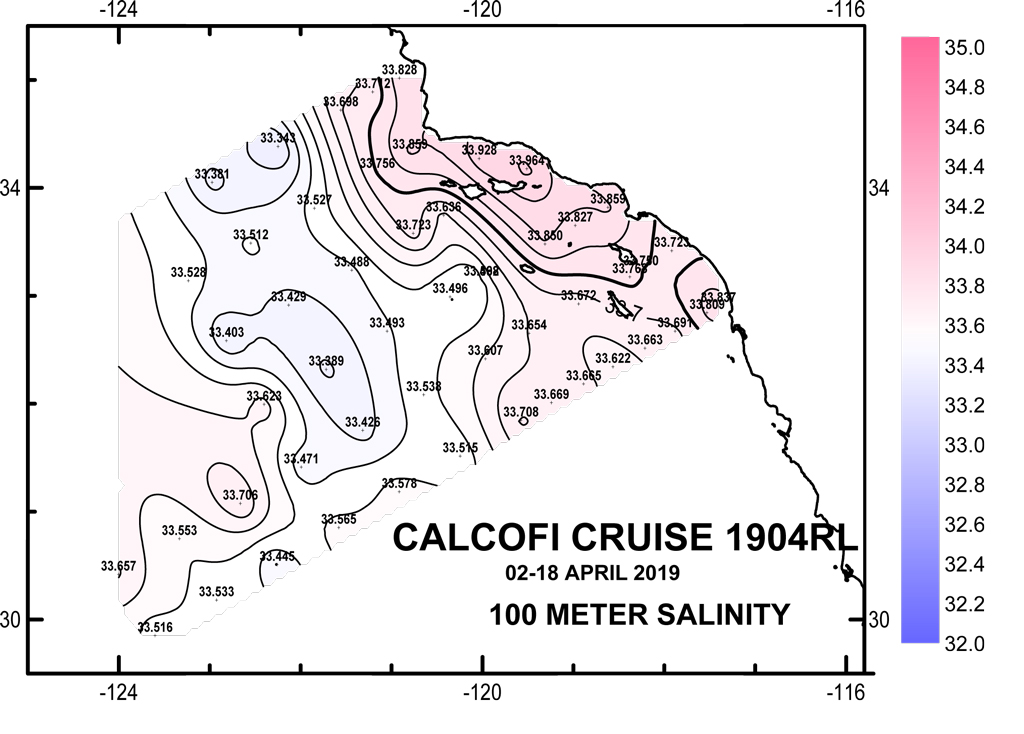
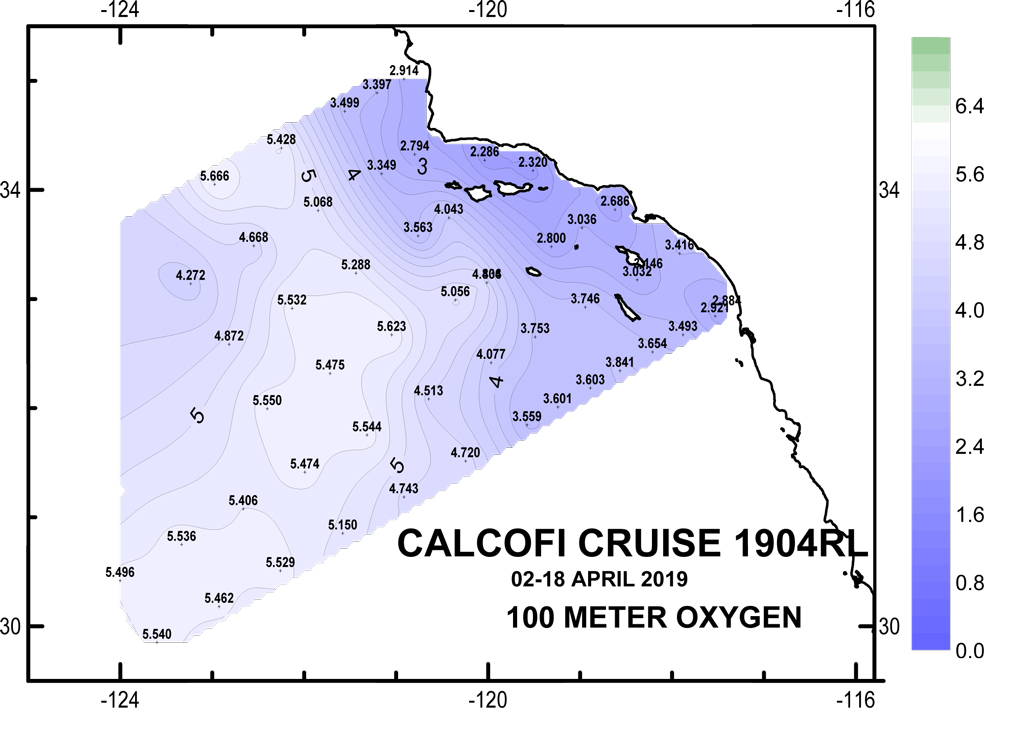
100 meter Preliminary CTD Data Contours
(Click for larger image)
100 meter Anomaly Contours (50 yr mean)
(Click for larger image)
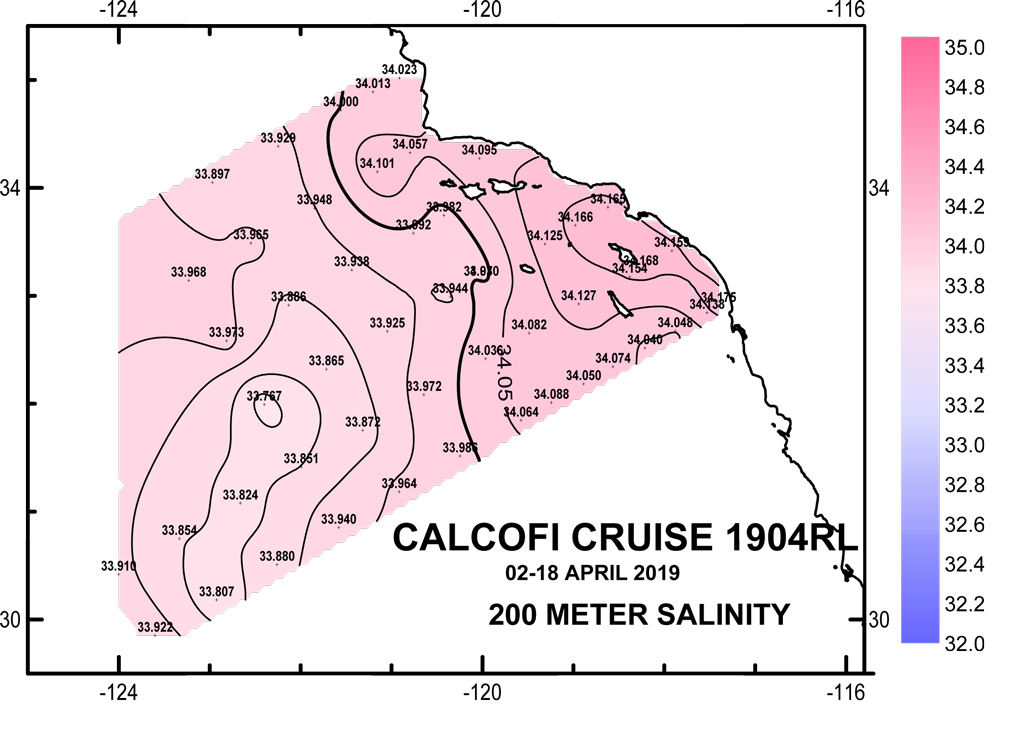
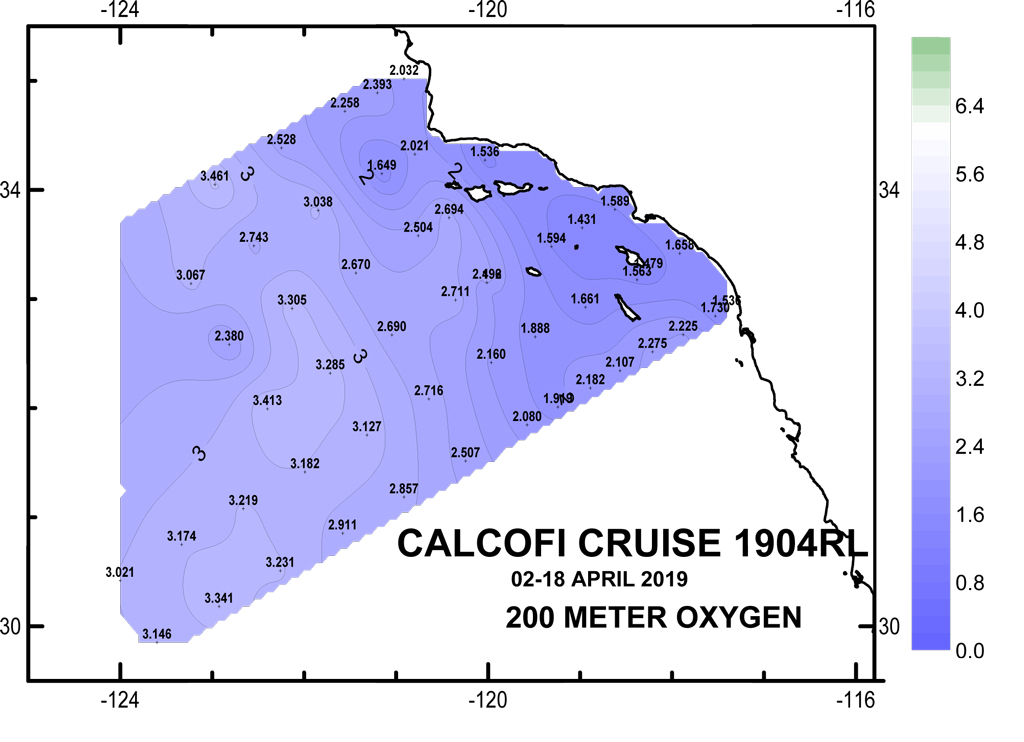
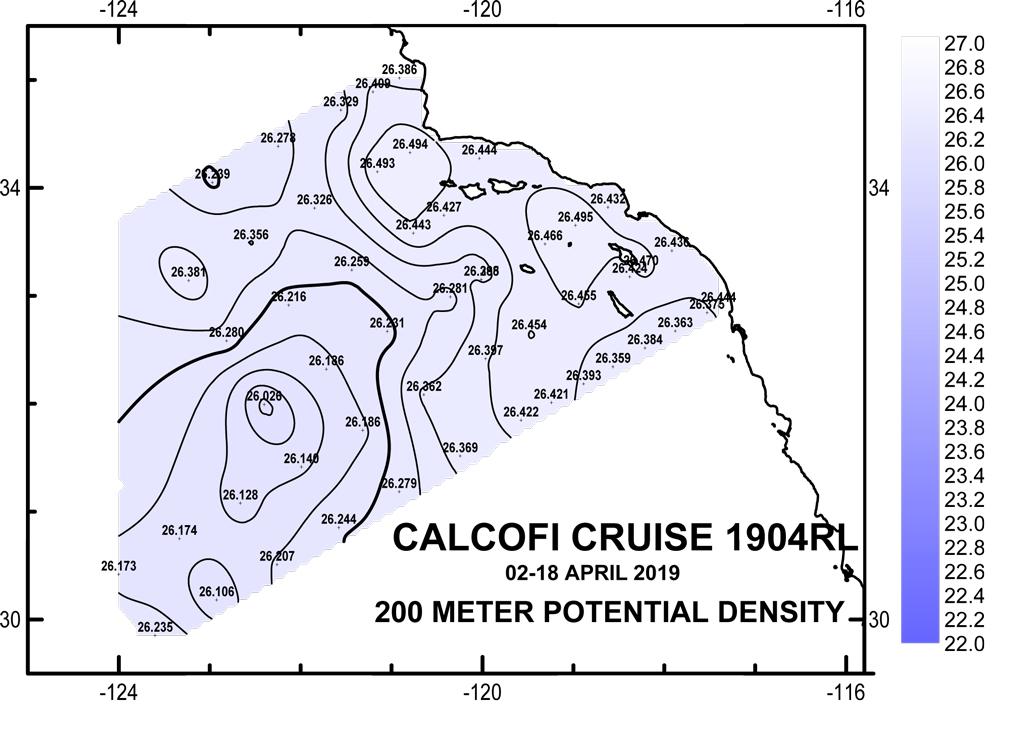
200 meter Preliminary CTD Data Contours
(Click for larger image)
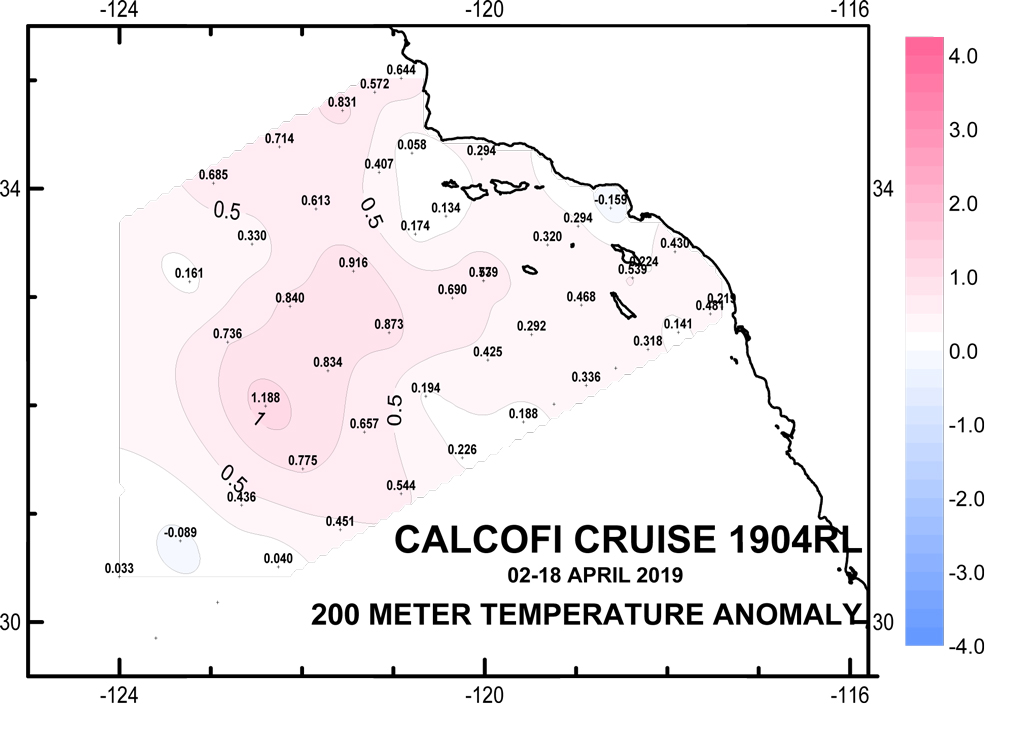
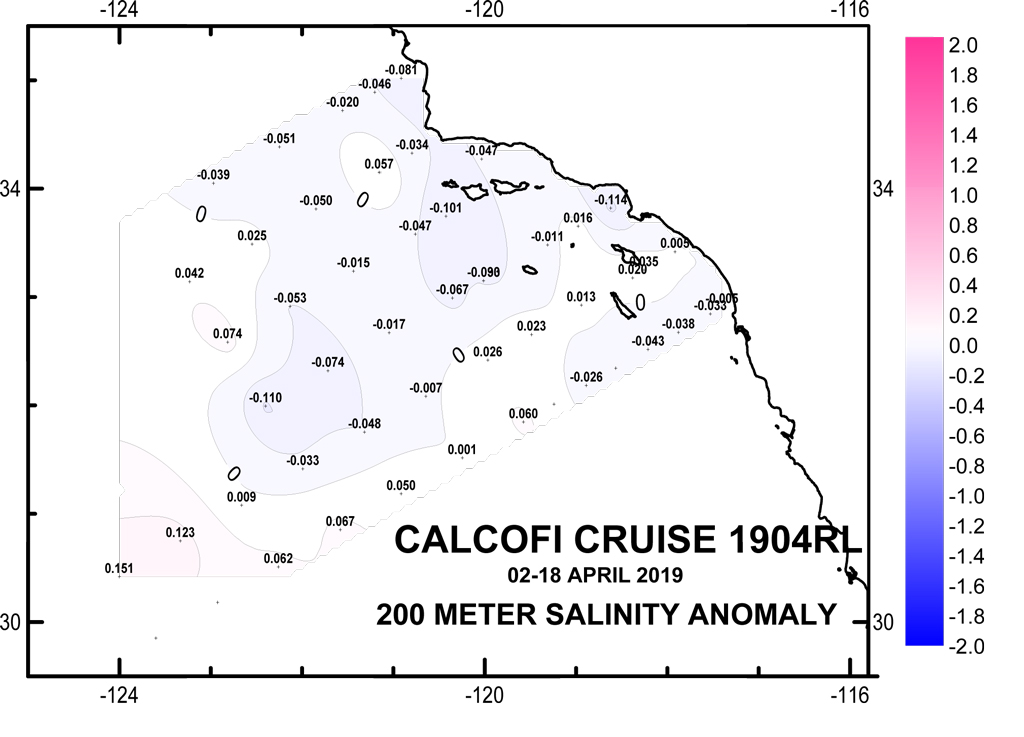
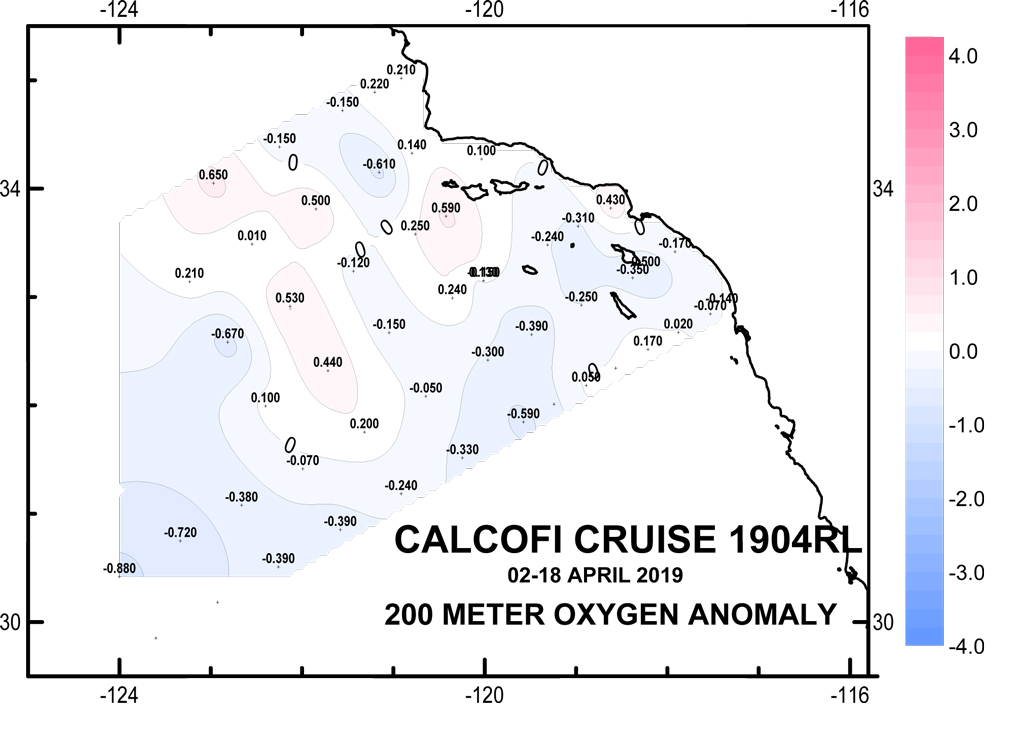
200 meter Anomaly Contours (50 yr mean)
(Click for larger image)
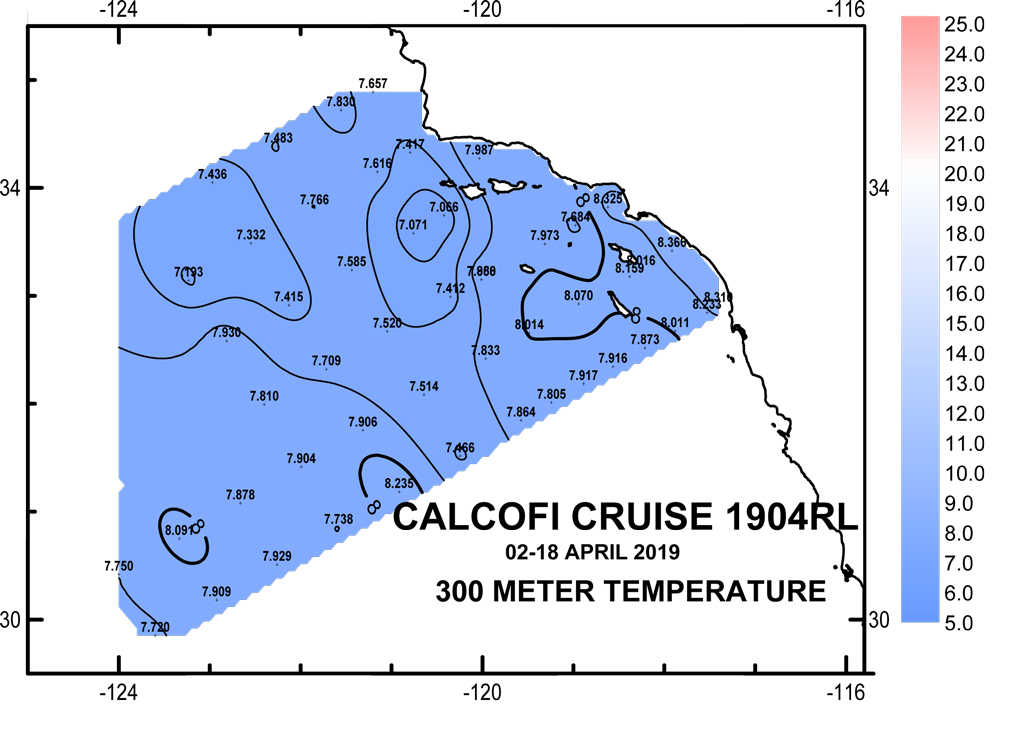
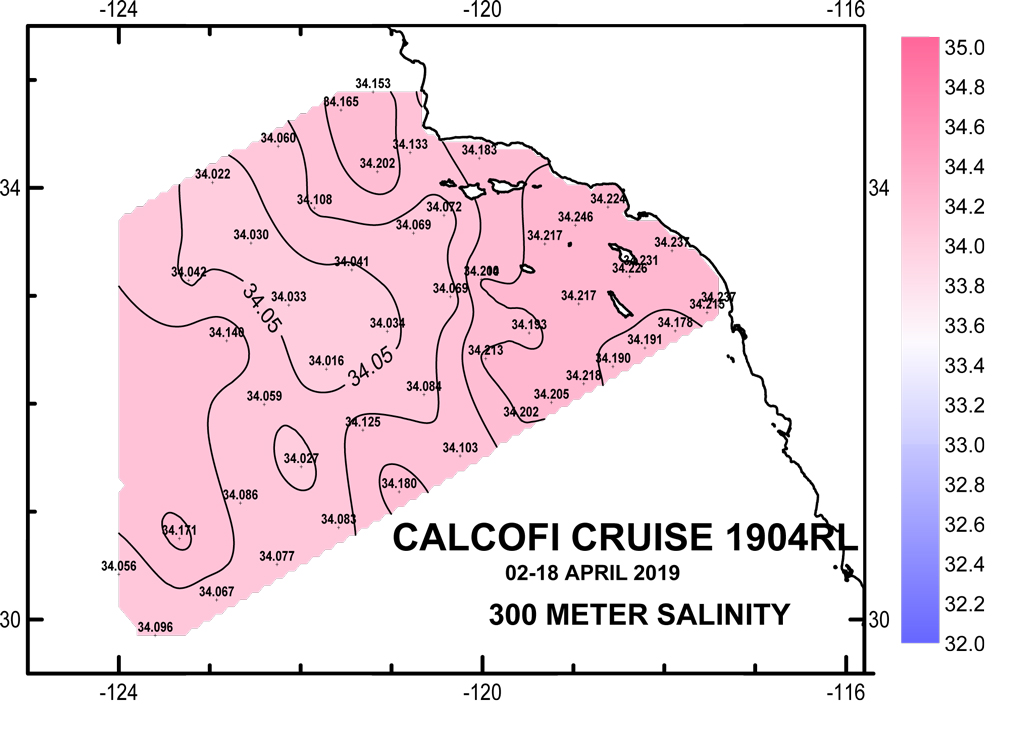
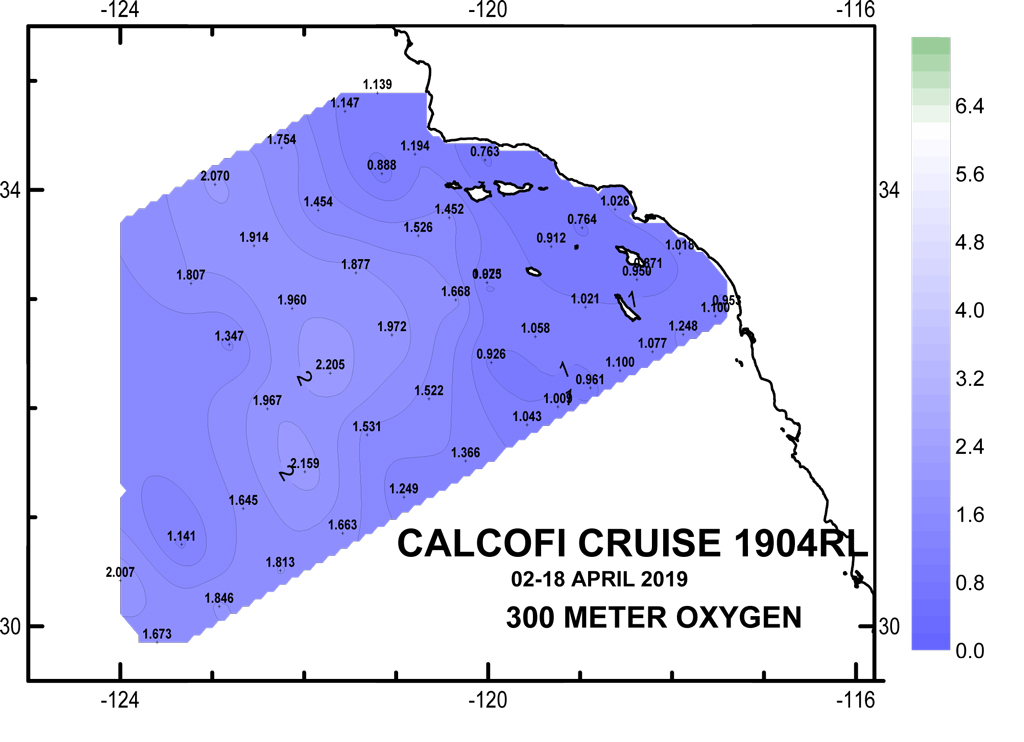
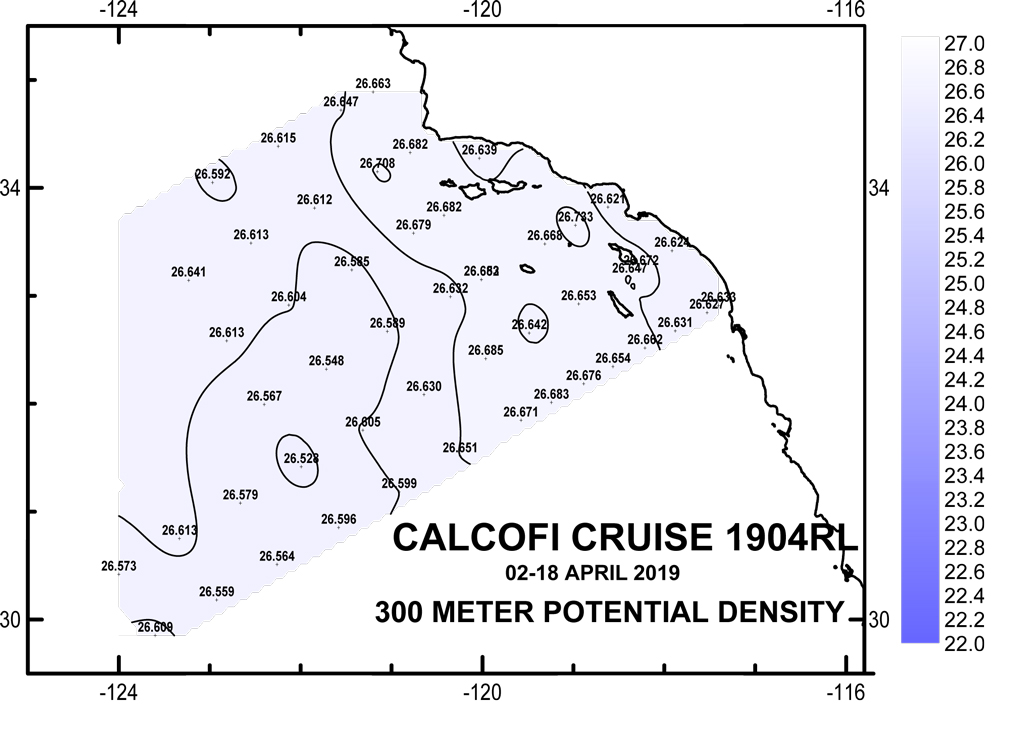
300 meter Preliminary CTD Data Contours
(Click for larger image)
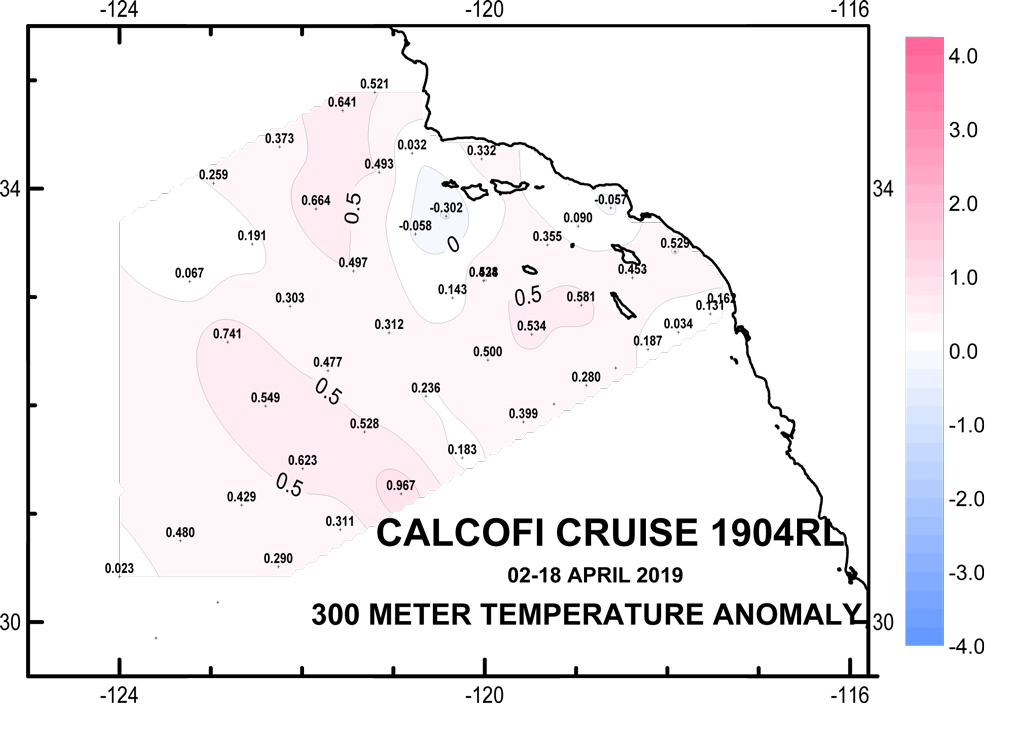
300 meter Anomaly Contours (50 yr mean)
(Click for larger image)
CTD Processing Notes
CTD Sensor Corrections:
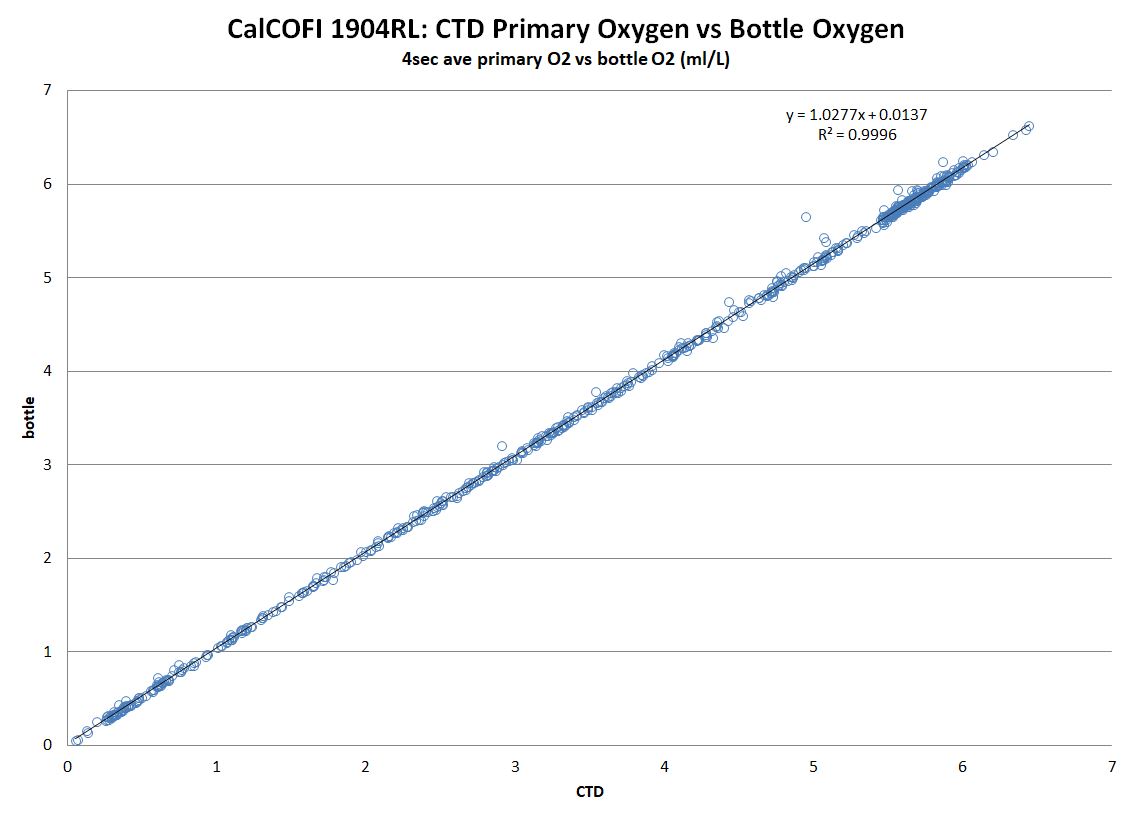
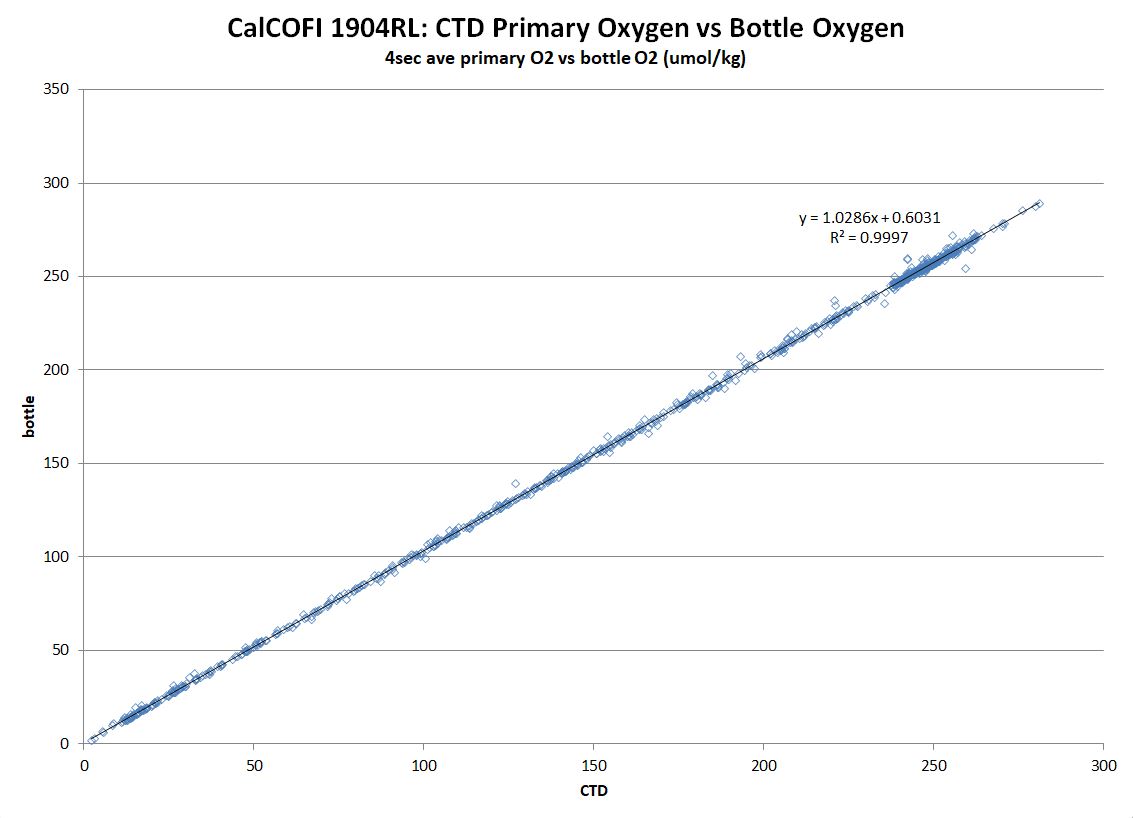
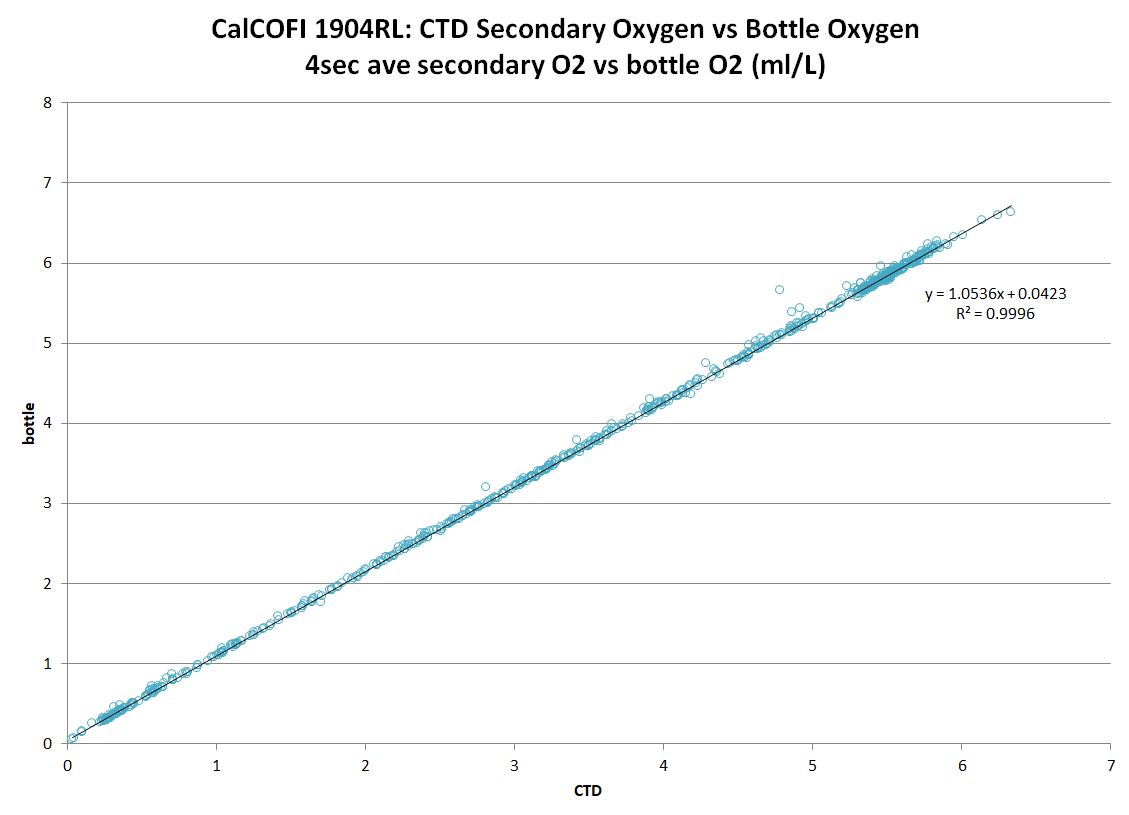
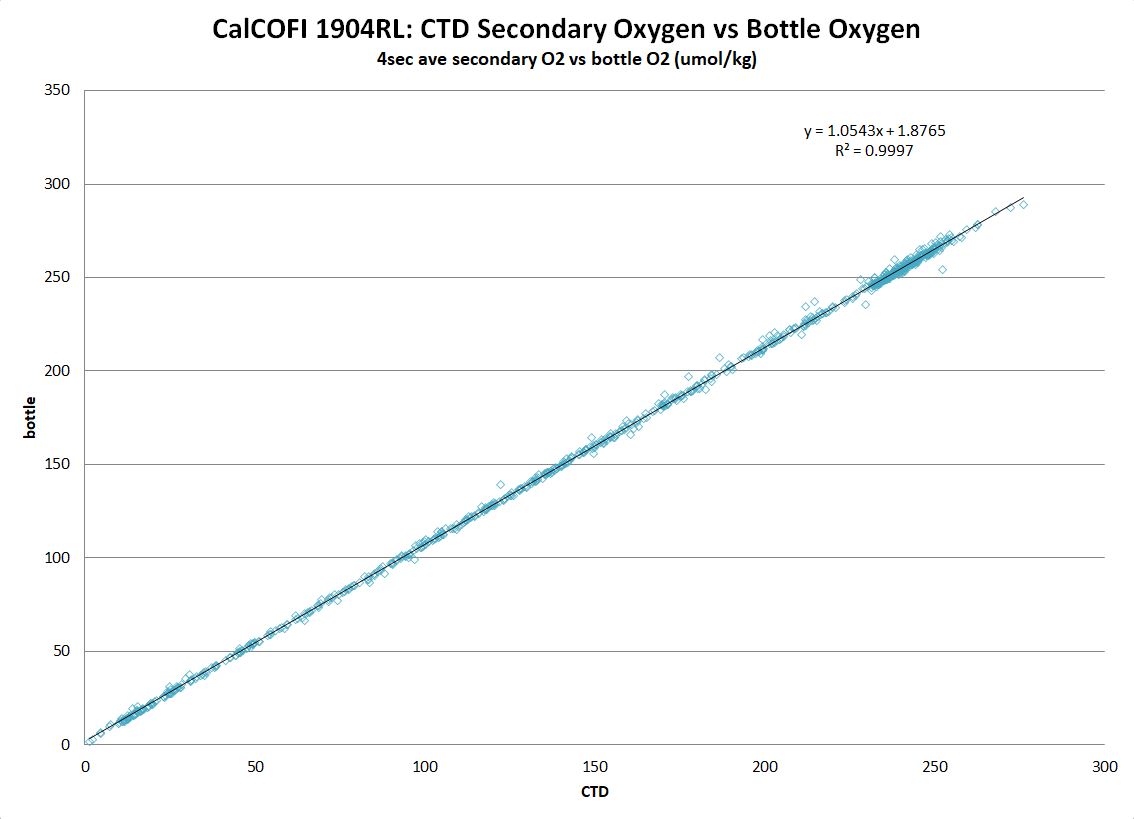
Derived by comparing sensor data (4 sec avg prior-to-bottle closure) to bottle samples.
Dual Salinity (Seabird SBE4) and Oxygen (Seabird SBE43) Sensors
PRIMARY SENSOR
SECONDARY SENSOR
Salinity offset (bottle - sensor; > 350 m)
-0.00218
0.002378
Oxygen ml/L
y = 1.0277x + 0.0137; R² = 0.9996
y = 1.0536x + 0.0423; R² = 0.9996
Oxygen umol/Kg
y = 1.0286x + 0.6031; R² = 0.9997
y = 1.0543x + 1.8765; R² = 0.9997
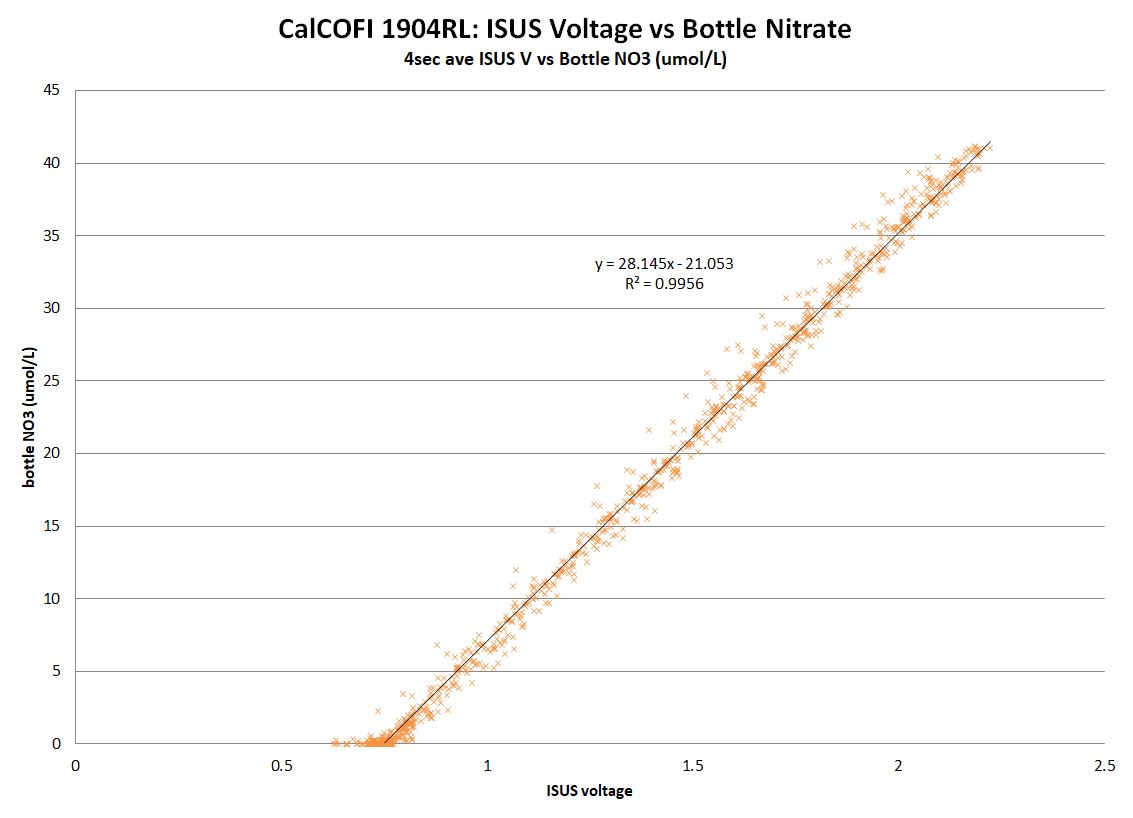
Single Nitrate (Satlantic ISUS v3 SN111) and Fluorescence (Wetlabs ECO AFL/FL) Sensors
LINEAR
POLYNOMIAL
Nitrate
y = 28.145x - 21.053; R² = 0.9956
Fluorescence
y = 13.85x - 0.5885; R² = 0.8241
y = 19.225x2+ 4.5721x - 0.1043; R² = 0.908
Regressions:
Please note: these regressions are generated from preliminary CTD vs bottle data and will be reprocessed once final bottle data are available. CTD temperatures and salinities do not usually change but oxygen, chlorophyll-a, and nitrate may change significantly after QAQC. Questionable or mistrip bottle data are removed from these comparisons but may be visible on the CTD.csv plots. For this cruise and future cruises, both primary & secondary sensor profiles vs bottle data will be generated and archived in the downloadable CTD+Bottle data files. These plots are under the “csv-plots\Primary” & “csv-plots\Secondary” subdirectories.