CalCOFI 1907BH sailed on RV Bold Horizon on 11 Jul 2019 at 0800PDT from 10th Ave Marine Terminal, San Diego. 70 of 75 science stations were successfully occupied. CTD casts and various net tows were completed at each science station. Underway visual observations of marine mammals and avifauna were conducted while under transit, coupled with sonobuoy deployments at each station to record marine mammal acoustics. Other underway science included continuous pCO2/pH and meteorological measurements. Approximately 12 hours were lost early in the cruise due to satellite communications malfunction. The ship diverted from the standard CalCOFI cruise track after 93.3 45.0 north to San Clemente Island for satellite repairs and resumed work at 93.3 50.0. The cruise ended 10th Ave Marine Terminal, San Diego on 26 Jul 2019.
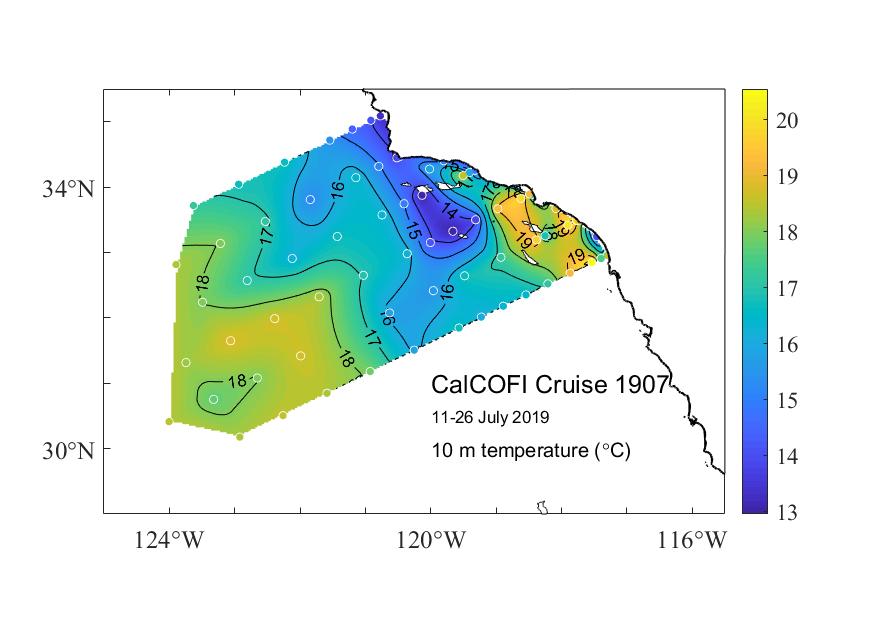
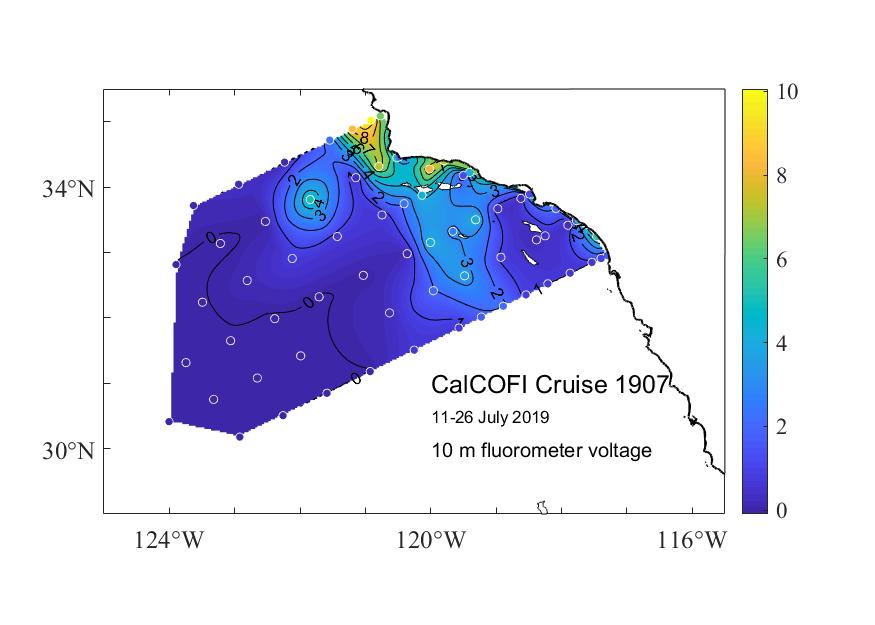
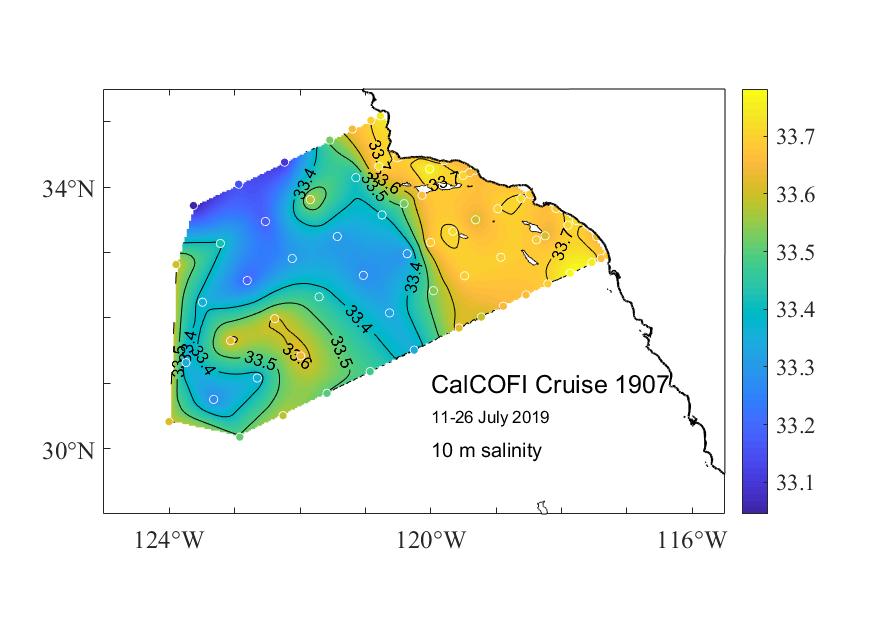
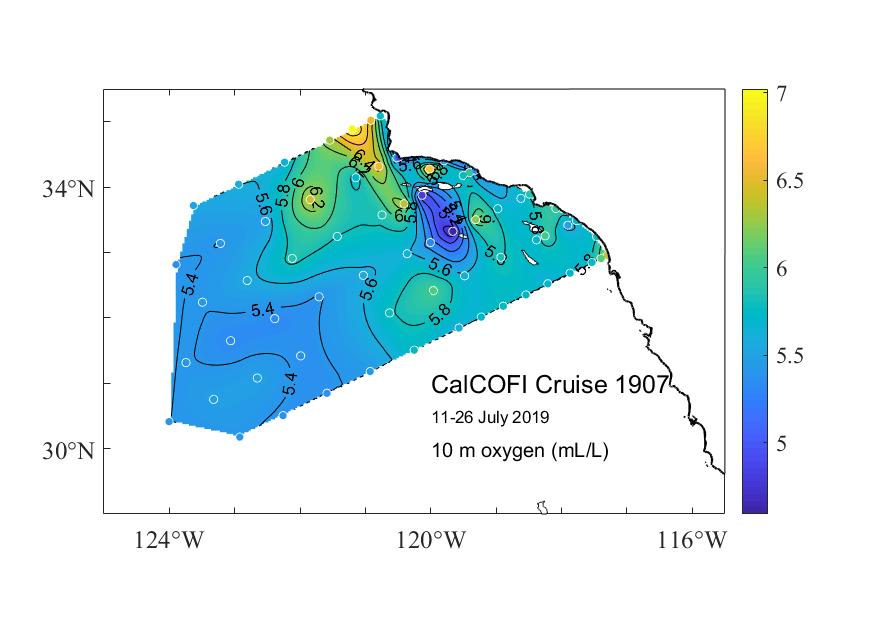
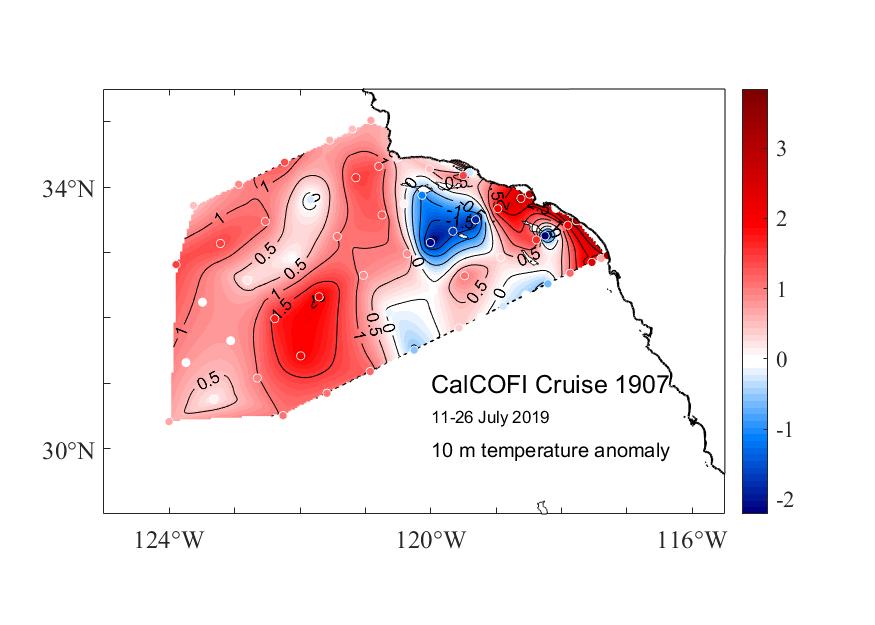
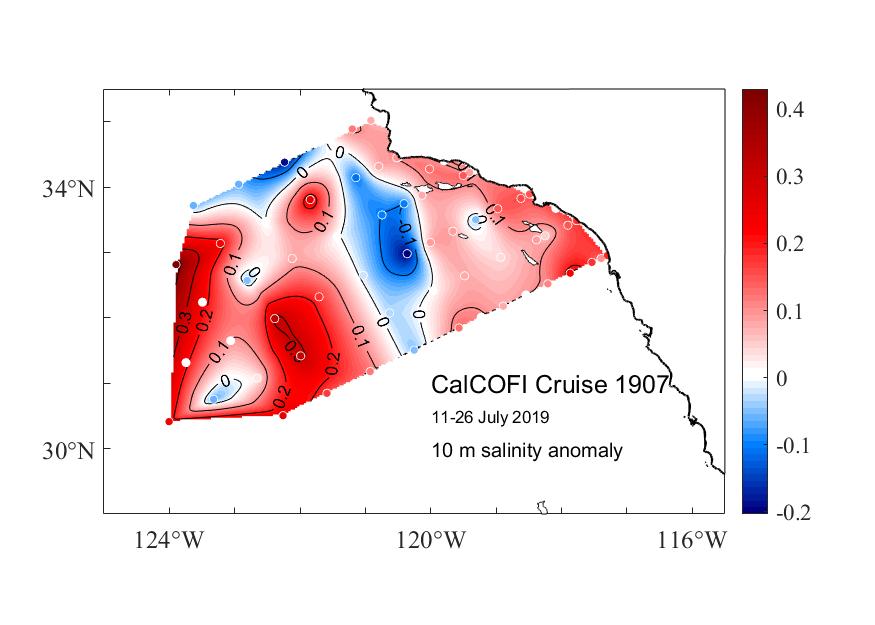
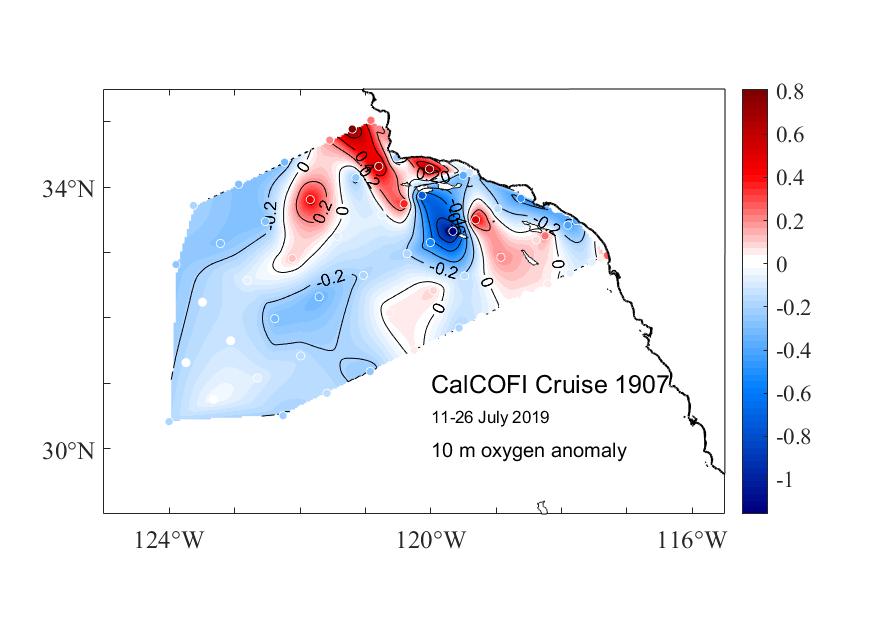
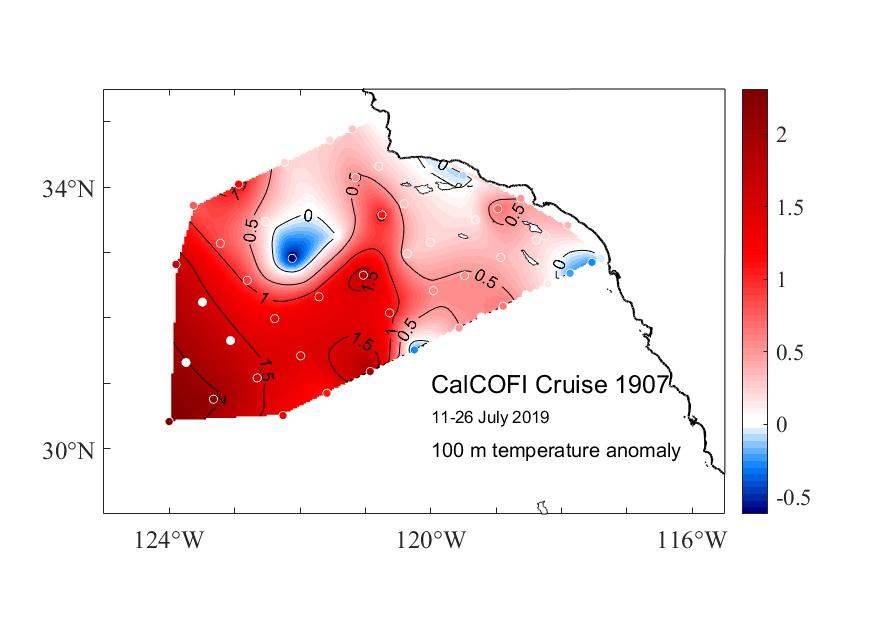
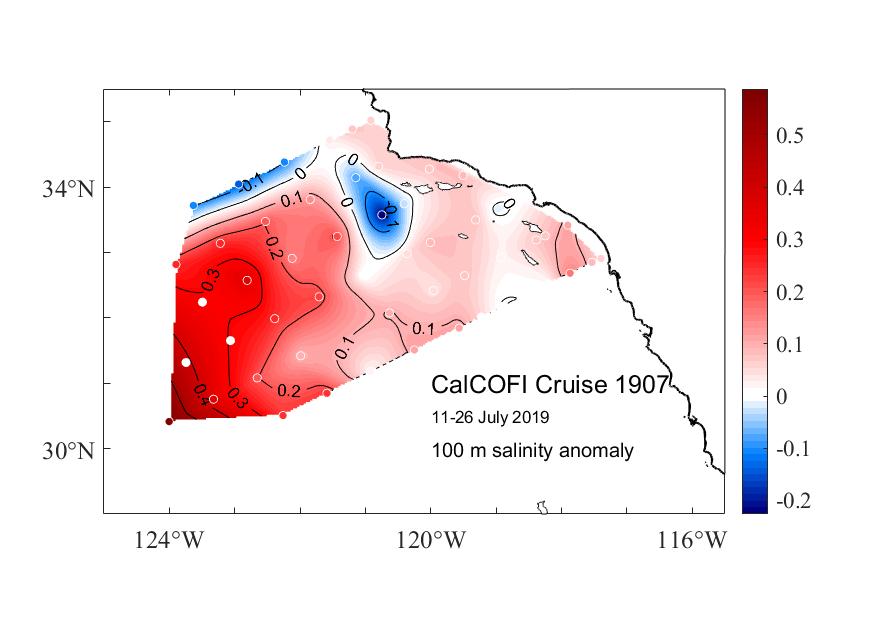
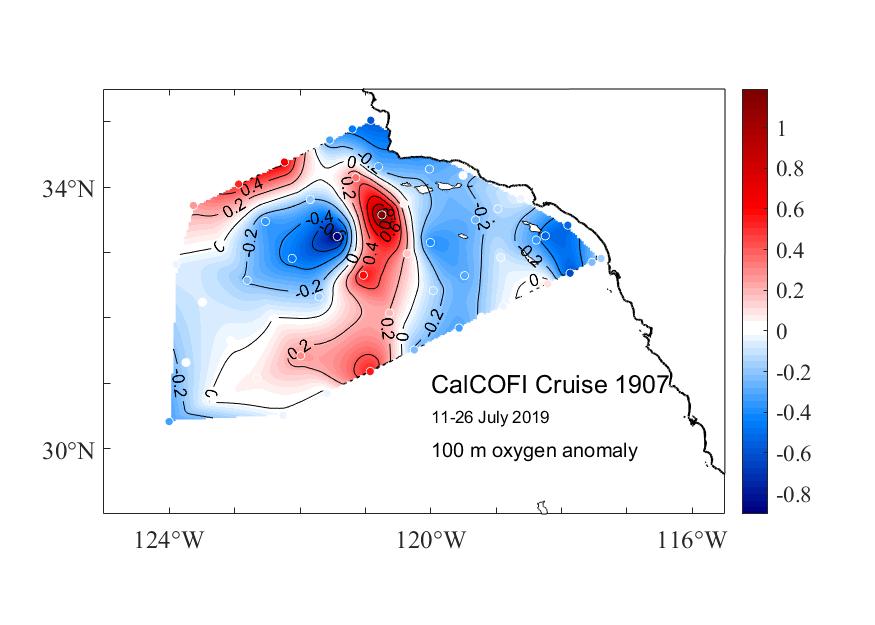
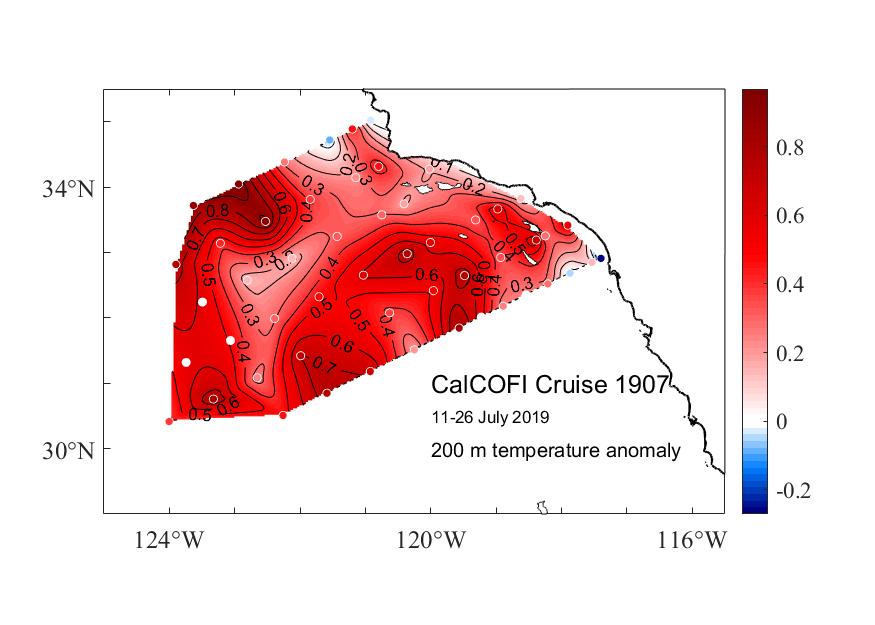
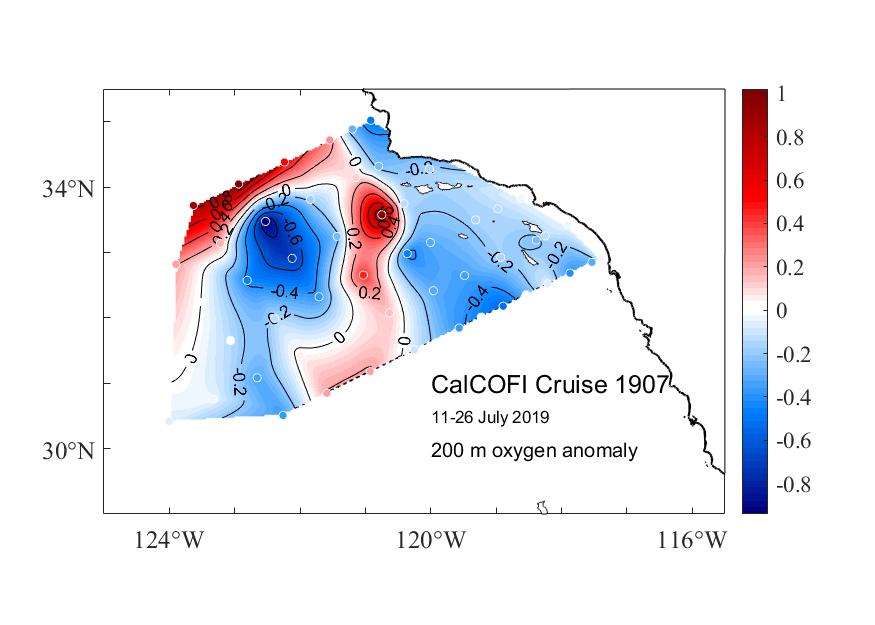
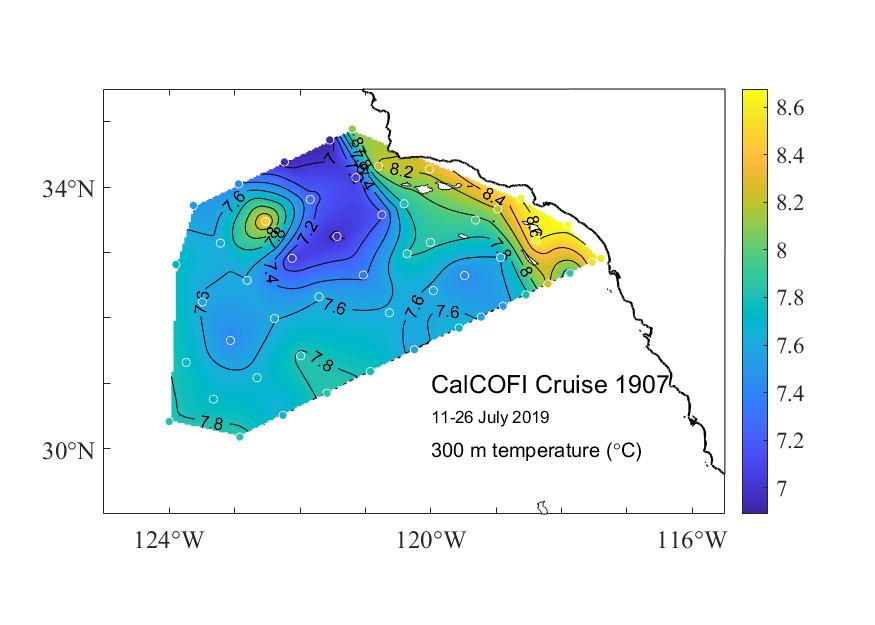
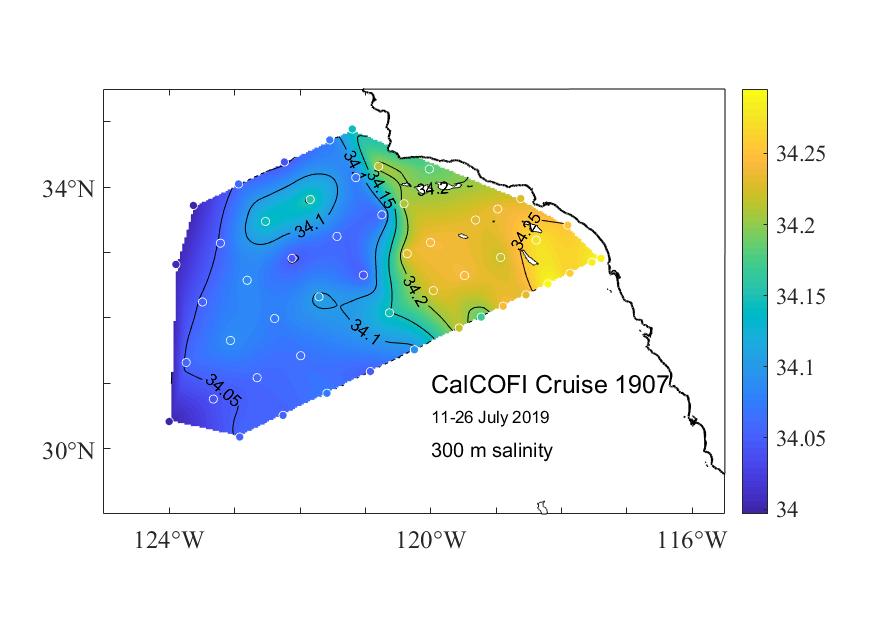
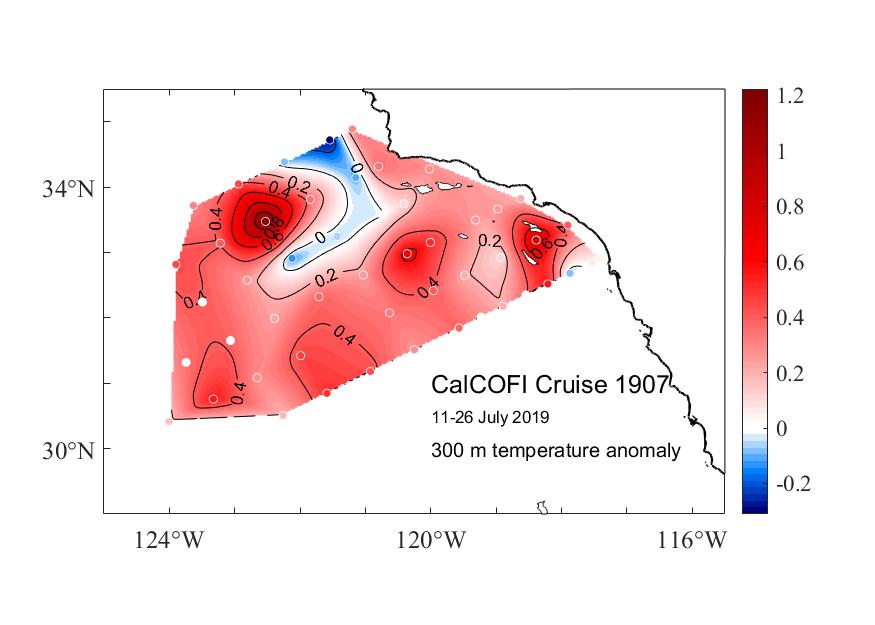
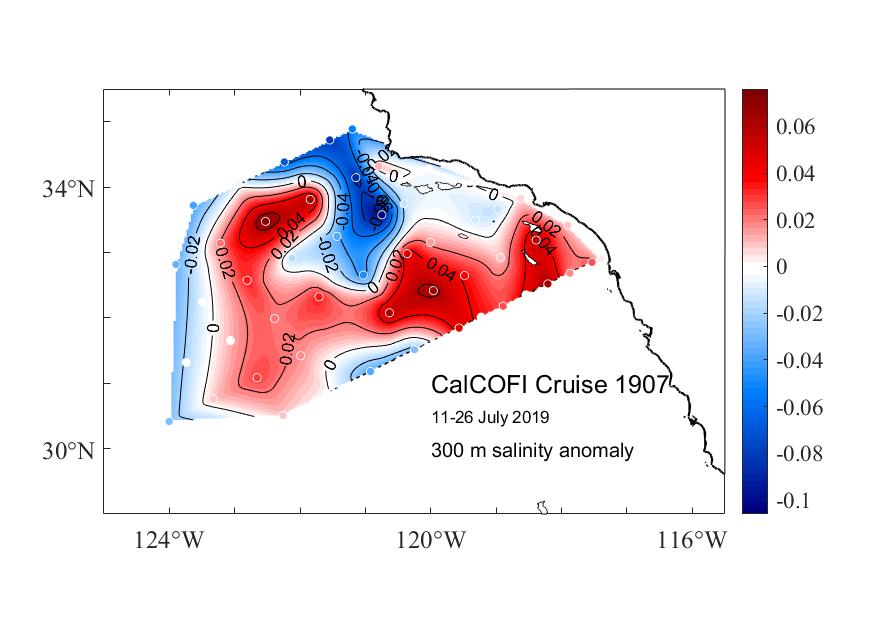
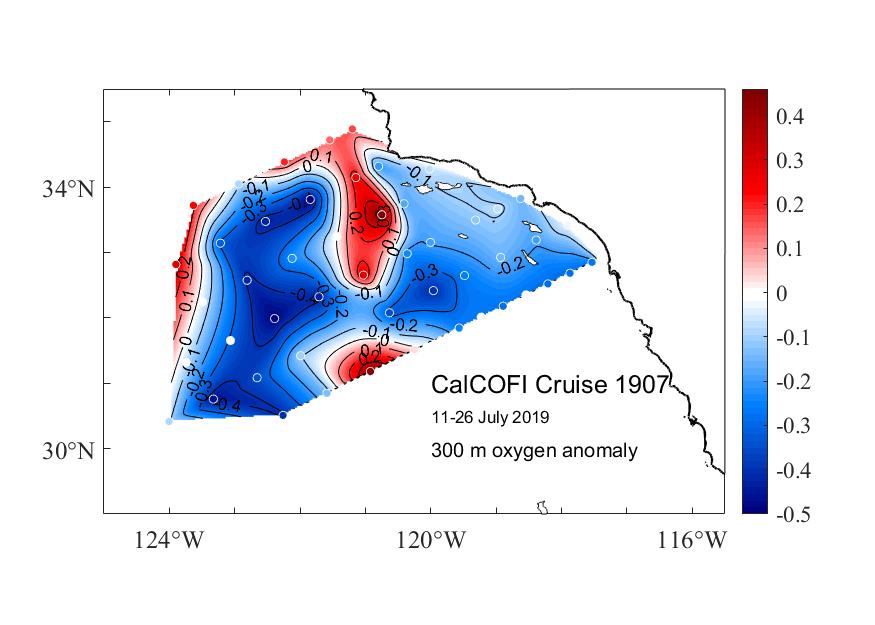
Please note: these data are 1m-bin-average Seasoft-processed CTD data that have not gone through quality control checks or bottle corrections. Anomalies are based on 50-year harmonics (1949-1999).
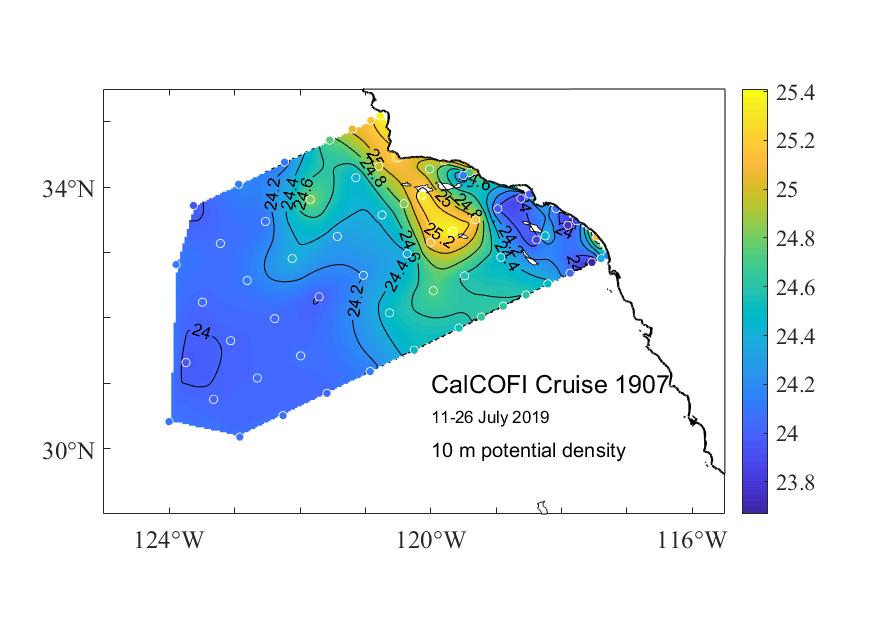
10 meter Preliminary CTD Data Contours
(Click for larger image)
10 meter Anomaly Contours (50 yr mean)
(Click for larger image)
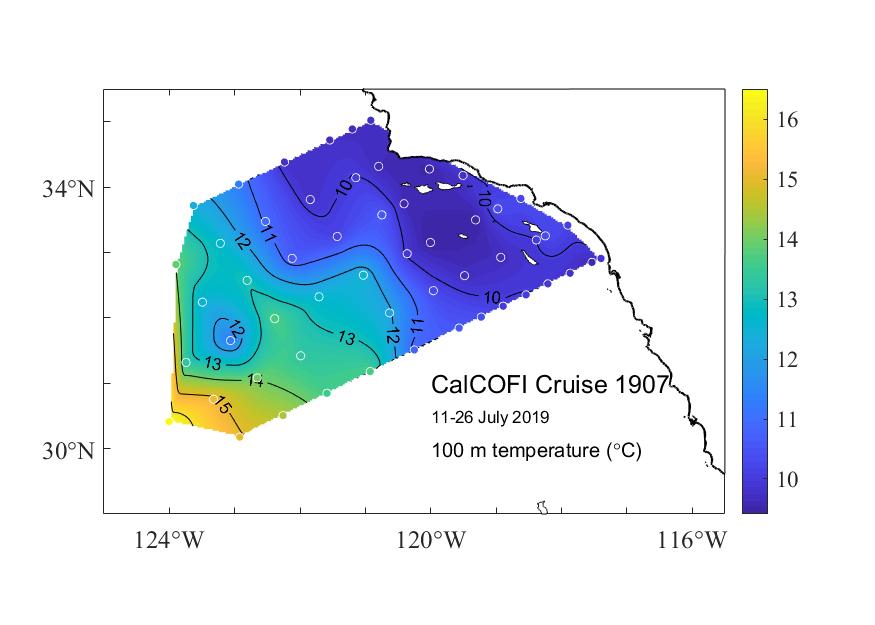
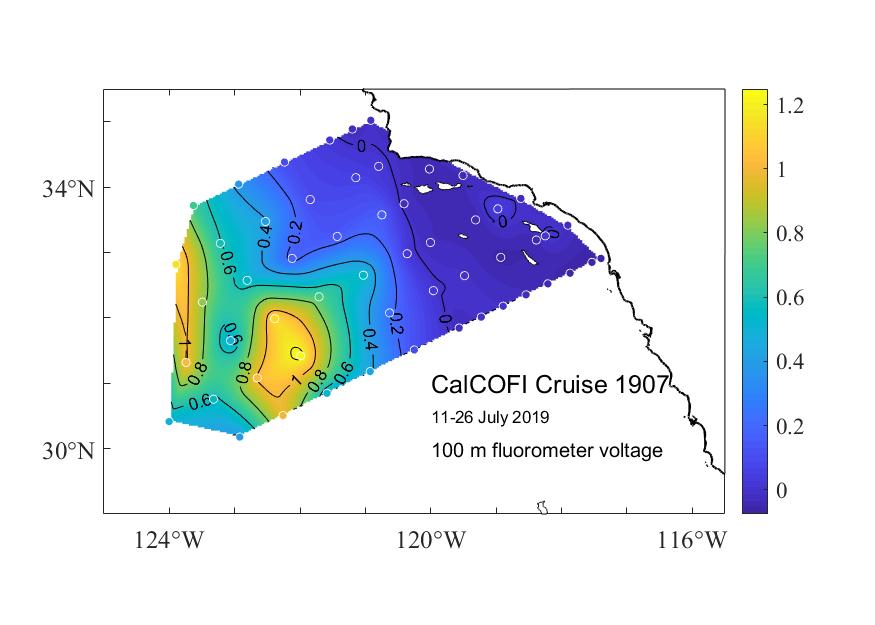
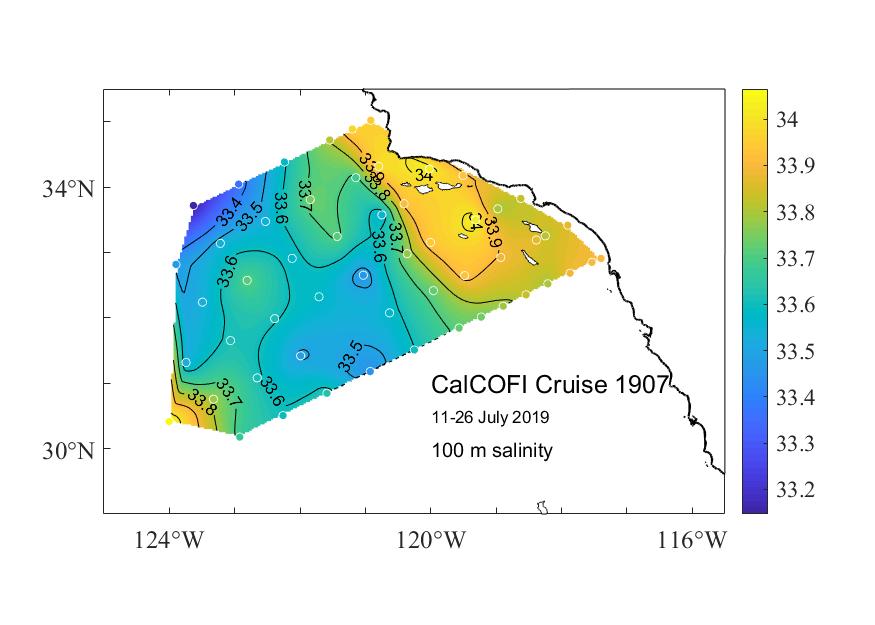
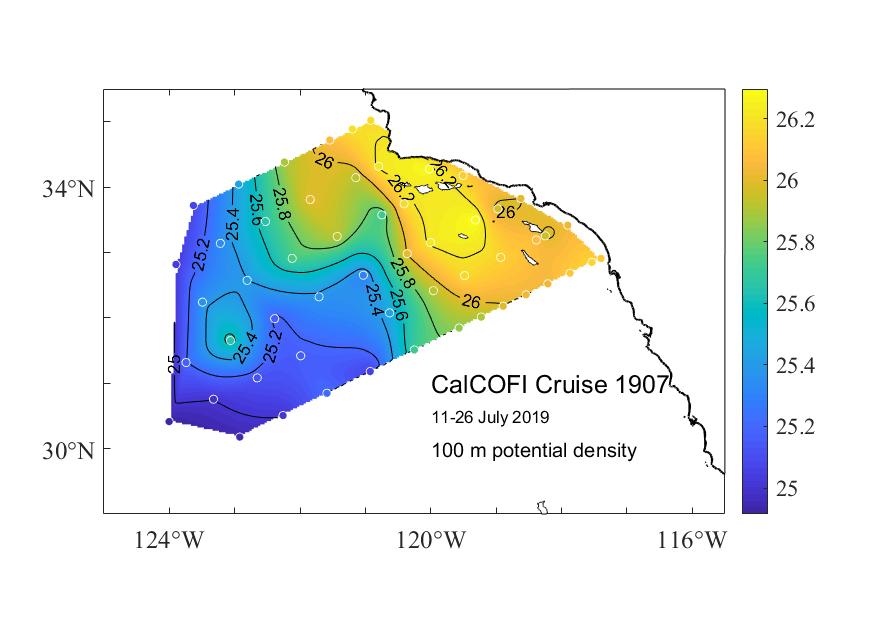
100 meter Preliminary CTD Data Contours
(Click for larger image)
100 meter Anomaly Contours (50 yr mean)
(Click for larger image)
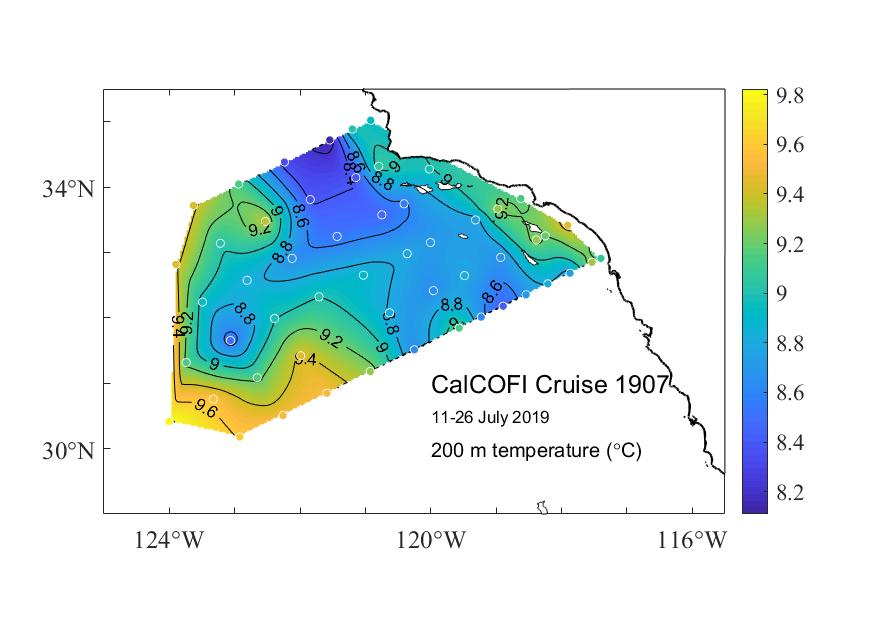
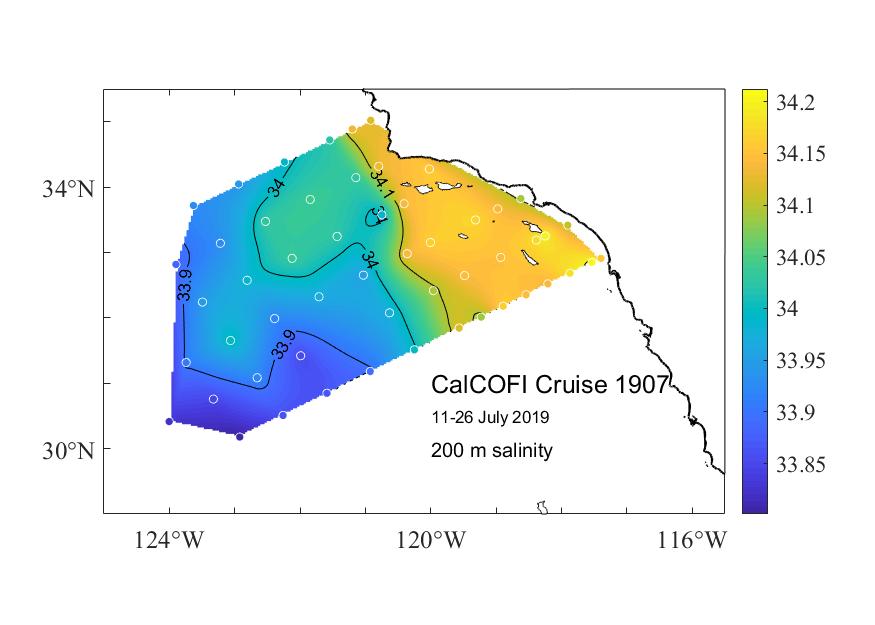
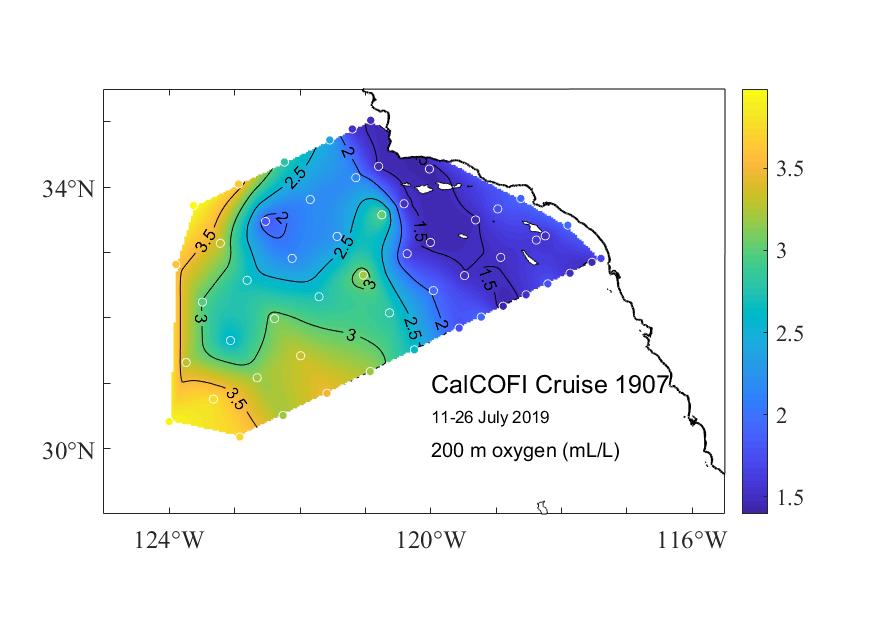
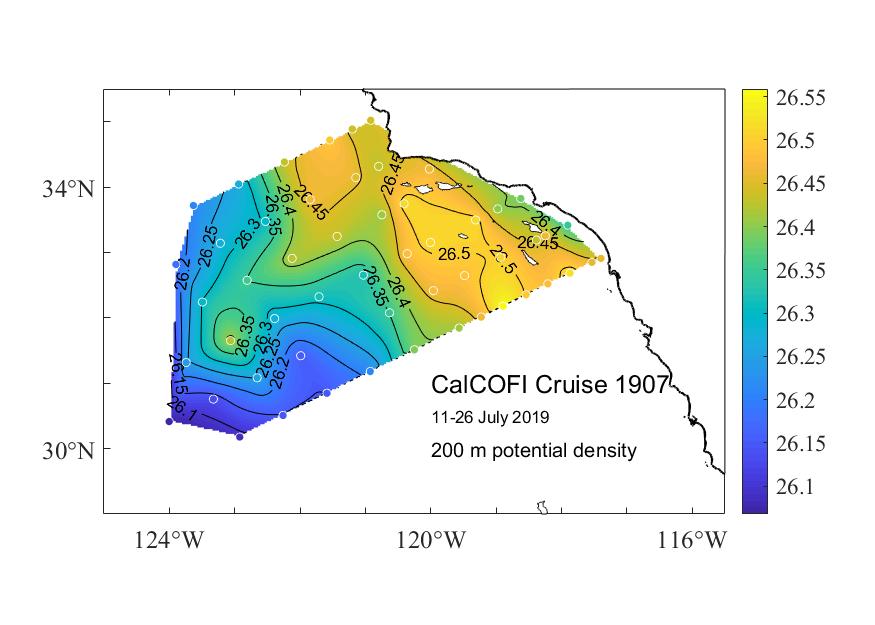
200 meter Preliminary CTD Data Contours
(Click for larger image)
200 meter Anomaly Contours (50 yr mean)
(Click for larger image)
300 meter Preliminary CTD Data Contours
(Click for larger image)
300 meter Anomaly Contours (50 yr mean)
(Click for larger image)
CTD Processing Notes
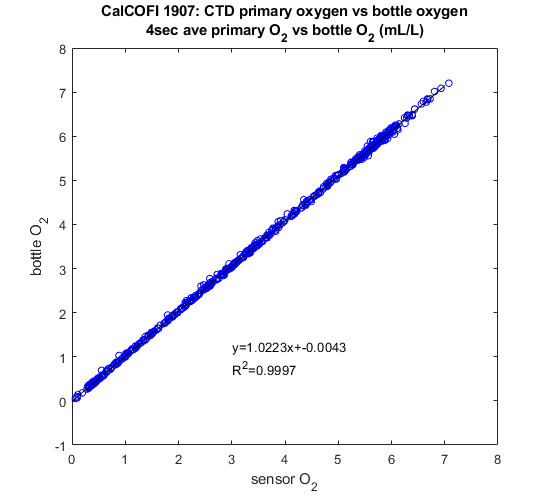
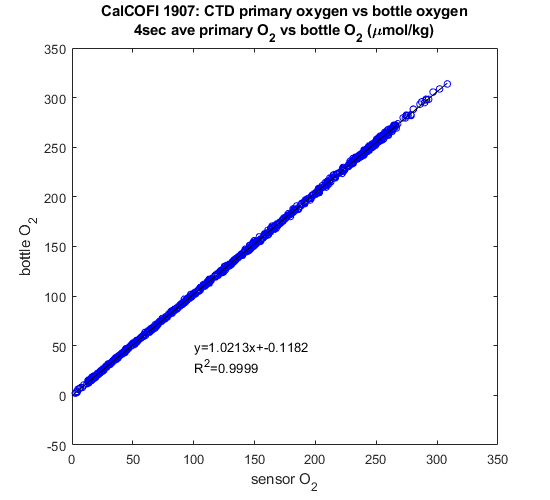
CTD Sensor Corrections:
Derived by comparing sensor data (4 sec avg prior-to-bottle closure) to bottle samples.
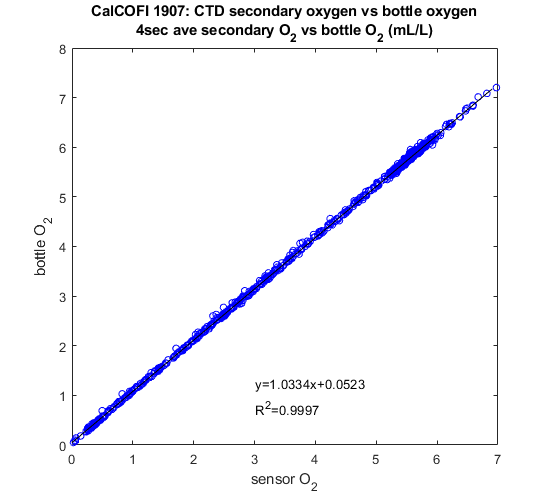
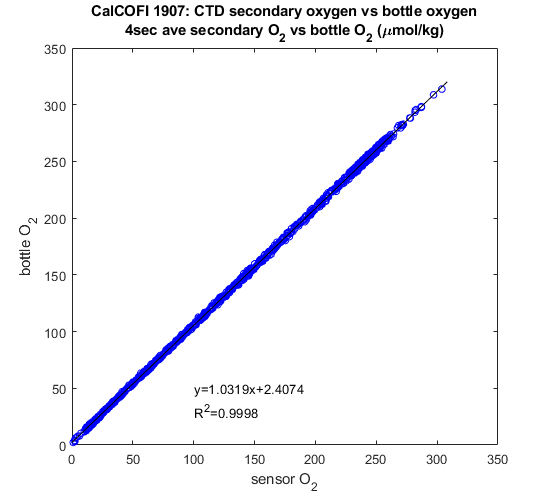
Dual Salinity (Seabird SBE4) and Oxygen (Seabird SBE43) Sensors
PRIMARY SENSOR
SECONDARY SENSOR
Salinity offset (bottle - sensor; > 350 m)
-0.0033
-0.0061
Oxygen ml/L
y = 1.0223x - 0.0043; R² = 0.9997
y = 1.0334x + 0.0523; R² = 0.9997
Oxygen umol/Kg
y = 1.0213x + 0.1182; R² = 0.9999
y = 1.0319x + 2.4074; R² = 0.9998
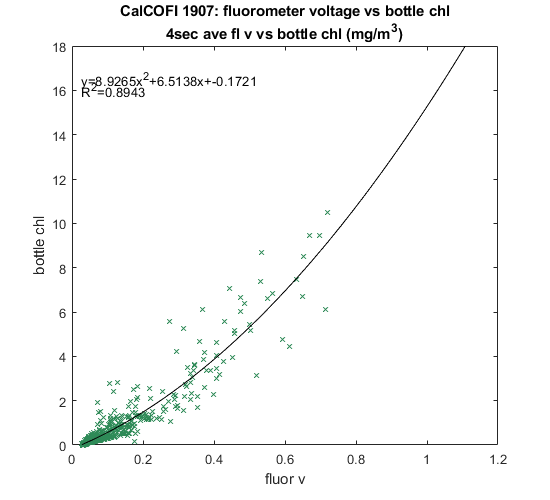
Single Nitrate (Satlantic ISUS v3 SN111) and Fluorescence (Wetlabs ECO AFL/FL) Sensors
LINEAR
POLYNOMIAL
Nitrate
y = 27.2958x - 27.8866; R² = 0.9929
Fluorescence
y = 11.0834x - 0.4148; R² = 0.8742
y = 8.9265x2+ 6.5138x - 0.1721; R² = 0.8943
Regressions:
Please note: these regressions are generated from preliminary CTD vs bottle data and will be reprocessed once final bottle data are available. CTD temperatures and salinities do not usually change but oxygen, chlorophyll-a, and nitrate may change significantly after QAQC. Questionable or mistrip bottle data are removed from these comparisons but may be visible on the CTD.csv plots. For this cruise and future cruises, both primary & secondary sensor profiles vs bottle data will be generated and archived in the downloadable CTD+Bottle data files. These plots are under the “csv-plots\Primary” & “csv-plots\Secondary” subdirectories.